
A First Course in Probability (10th Edition)
10th Edition
ISBN: 9780134753119
Author: Sheldon Ross
Publisher: PEARSON
expand_more
expand_more
format_list_bulleted
Related questions
Concept explainers
Question
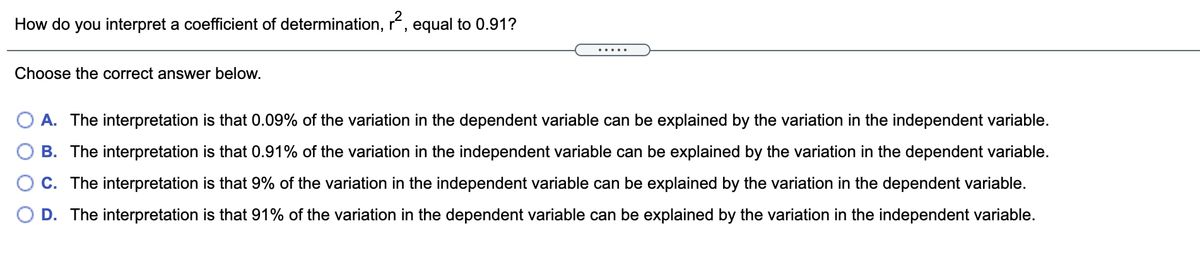

Transcribed Image Text:How do you interpret a coefficient of determination, r, equal to 0.91?
.....
Choose the correct answer below.
O A. The interpretation is that 0.09% of the variation in the dependent variable can be explained by the variation in the independent variable.
B. The interpretation is that 0.91% of the variation in the independent variable can be explained by the variation in the dependent variable.
C. The interpretation is that 9% of the variation in the independent variable can be explained by the variation in the dependent variable.
D. The interpretation is that 91% of the variation in the dependent variable can be explained by the variation in the independent variable.
Expert Solution
This question has been solved!
Explore an expertly crafted, step-by-step solution for a thorough understanding of key concepts.

This is a popular solution

Trending nowThis is a popular solution!

Step by stepSolved in 2 steps with 2 images

Knowledge Booster


Learn more about
Need a deep-dive on the concept behind this application? Look no further. Learn more about this topic, probability and related others by exploring similar questions and additional content below.Similar questions
- Which one shows the greatest improvement, according to the percent changes? Lois Chris Meg Peter Brian Stewiearrow_forwardComplete the following statements: 1. In general,________ % of the values in a data set lie at or below the 54th percentile. 2. _______ % of the values in a data set lie above the 24th percentile.arrow_forwardStatistics Questionarrow_forward
- Using the same data and information. Please answer this: Should you be encouraging or discouraging credit card sales? In answering this question, consider the following: Is the proportion of credit and non-credit sales significantly different? (a=.05) Is the average sale amount for credit sales different than the average sales amount for non-credit sales? (a=.05)arrow_forwardIs parameter proportion the same as statistical proportion. so lets say the statistical proportion is 0.49. Would the parameter proportion be 0.49 as well ?arrow_forwardixd s 67 Dr 5. Find the percentage of data points that lie above z 1.03. Draw a picture to support your work.arrow_forward
- Determine the percent of data greater than z=−1.50. The percent of data greater than z=−1.50 isarrow_forwardDo you think the mean:44.19 or the median:30 better represents the data? Explain your reasoningarrow_forwardUsing the coefficient of variation, how much (%) do these data sets vary? (rounding to the nearest percent) Data Set 1: ¯x¯=12 and s=7 Data Set 2: ¯x¯=0.12 and s=0.3.arrow_forward
arrow_back_ios
arrow_forward_ios
Recommended textbooks for you
- A First Course in Probability (10th Edition)ProbabilityISBN:9780134753119Author:Sheldon RossPublisher:PEARSON

A First Course in Probability (10th Edition)
Probability
ISBN:9780134753119
Author:Sheldon Ross
Publisher:PEARSON