
MATLAB: An Introduction with Applications
6th Edition
ISBN: 9781119256830
Author: Amos Gilat
Publisher: John Wiley & Sons Inc
expand_more
expand_more
format_list_bulleted
Related questions
Question
How do I find the indicated IQ score when the given mean is 100 and the give standard divatation is 15 and the area is 0.3204?
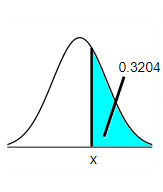

Transcribed Image Text:The image shows a normal distribution curve, also known as a bell curve. This is a continuous probability distribution commonly used in statistics. The curve is symmetrical and depicts the distribution of data points where most occurrences take place near the mean, forming a peak in the center.
In this diagram:
- The horizontal axis is labeled as "X," representing the variable of interest.
- The vertical line intersects the curve and corresponds to a specific value on the X-axis.
- To the right of this line, a portion of the curve is shaded in light blue.
- The shaded area represents a probability region, which corresponds to a value of 0.3204. This indicates that the probability of the variable falling within this range is 32.04%.
This graph is often used to illustrate the concept of cumulative probability and to show the portion of data within a standard deviation from the mean.

Transcribed Image Text:**Help Me Solve This | 4 parts remaining**
Find the indicated IQ score. The graph to the right depicts IQ scores of adults, and those scores are normally distributed with a mean of 100 and a standard deviation of 15.
***
While technology or a standard normal distribution table can be used to identify the z-score corresponding to the given area, for this problem use technology. Note that with many technologies, the x-value can be found directly.
Identify the z-score corresponding to an area of 0.3204 to the right of x, as shown in the graph.
The z-score is ____.
(Round to two decimal places as needed.)
---
**Graph Description:**
The graph shown is a normal distribution curve illustrating IQ scores. The shaded area on the right of point x represents an area of 0.3204 under the curve, highlighting the portion of scores greater than x.
Expert Solution
This question has been solved!
Explore an expertly crafted, step-by-step solution for a thorough understanding of key concepts.

This is a popular solution

Trending nowThis is a popular solution!

Step by stepSolved in 2 steps with 2 images

Knowledge Booster

Similar questions
- You are conducting a study to see if the average female life expectancy is significantly different from 81. Your sample data (n=17) produce the test statistic t=-2.67. Find the p-value accurate to 4 decimal places.arrow_forwardThank you :3 Cholesterol levels between 170 mg/dl and 200 mg/dI are considered borderline high for teenagers. What percent of teen boys have borderline high cholesterol levels? Explain. Show workarrow_forwardThe data for a chi-square test consist of numerical scores non-numerical categories ranks frequenciesarrow_forward
- You are conducting a study to see if the proportion of men over 50 who regularly have their prostate examined is significantly less than 0.82. Your sample data produce the test statistic z = - 2.97 Find the p-value accurate to 4 decimal places.arrow_forward10 veterans who suffer from PTSD are tested before and after taking an anti-anxiety medication thought to reduce PTSD symptoms. How do I report my findings in APA format? Before condition (M=52, SD= 13.4, SE=4.228) After condition (M=43, SD=13.4, SE=4.243) t(9)=1.581, p >0.05, d=0.500.arrow_forward#4). show work, need help solvingarrow_forward
- A population of N=15 has a mean =8 one score in the population is changed from X=20 to X-5.What is the value for thr new population mean?arrow_forwardI have a dataset from 600 preschoolers with measures of grip strength for each individual. One individual subject had a z score of -1.5. Approximately how many preschoolers would have a grip strength lower than this individual. Show work please I don't understandarrow_forward
arrow_back_ios
arrow_forward_ios
Recommended textbooks for you
- MATLAB: An Introduction with ApplicationsStatisticsISBN:9781119256830Author:Amos GilatPublisher:John Wiley & Sons Inc
 Probability and Statistics for Engineering and th...StatisticsISBN:9781305251809Author:Jay L. DevorePublisher:Cengage Learning
 Statistics for The Behavioral Sciences (MindTap C...StatisticsISBN:9781305504912Author:Frederick J Gravetter, Larry B. WallnauPublisher:Cengage Learning
  Elementary Statistics: Picturing the World (7th E...StatisticsISBN:9780134683416Author:Ron Larson, Betsy FarberPublisher:PEARSON
 The Basic Practice of StatisticsStatisticsISBN:9781319042578Author:David S. Moore, William I. Notz, Michael A. FlignerPublisher:W. H. Freeman
 Introduction to the Practice of StatisticsStatisticsISBN:9781319013387Author:David S. Moore, George P. McCabe, Bruce A. CraigPublisher:W. H. Freeman
MATLAB: An Introduction with Applications
Statistics
ISBN:9781119256830
Author:Amos Gilat
Publisher:John Wiley & Sons Inc
Probability and Statistics for Engineering and th...
Statistics
ISBN:9781305251809
Author:Jay L. Devore
Publisher:Cengage Learning
Statistics for The Behavioral Sciences (MindTap C...
Statistics
ISBN:9781305504912
Author:Frederick J Gravetter, Larry B. Wallnau
Publisher:Cengage Learning
Elementary Statistics: Picturing the World (7th E...
Statistics
ISBN:9780134683416
Author:Ron Larson, Betsy Farber
Publisher:PEARSON
The Basic Practice of Statistics
Statistics
ISBN:9781319042578
Author:David S. Moore, William I. Notz, Michael A. Fligner
Publisher:W. H. Freeman
Introduction to the Practice of Statistics
Statistics
ISBN:9781319013387
Author:David S. Moore, George P. McCabe, Bruce A. Craig
Publisher:W. H. Freeman