Concept explainers
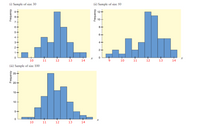
Histograms of random sample data are often used as an indication of the shape of the underlying population distribution. The histograms on below are based on random samples of size 30, 50, and 100 from the same population.
(a) Using the midpoint labels of the three histograms, what would you say about the estimated
Complete the table giving the range of the sample data in each of the histograms.
| Smallest Value | Largest Value | |
| Histogram (i) | ||
| Histogram (ii) | ||
| Histogram (iii) |
Based on the completed table, select the most reasonable estimate of the range of the population data.

(a) From the picture given:
| Smallest Value | Largest Value | |
| Histogram (i) | 9.5 | 14 |
| Histogram (ii) | 9 | 14 |
| Histogram (iii) | 9.5 | 14.5 |
Based on the table, the most reasonable estimate of the range of the population data is option (iv) 9 to 15.
Option (i) Since there are very few values outside the range 10 to 14, we can say that the bulk of the data is between 10 and 14.
This is the correct option for this.
Trending nowThis is a popular solution!
Step by stepSolved in 3 steps

- The midterm and final exam grades for a statistics course are provided in the data set below. Jaymes, a student in the class, scored 86 on both exams. Treat the given data sets as samples. Midterm: 80, 78, 85, 82, 79, 79, 78, 86, 80, 84, 78, 84, 80, 84, 81, 78, 81, 82, 78, 84 Final: 81, 88, 68, 69, 69 81, 82, 86, 76, 71, 72, 68, 77, 86, 68, 83, 84, 71, 81, 87 z-score for midterm: 1.857 z-score for final: 1.181 Based on the z-scores calculated above, which of Jaymes's grades is more unusual, the midterm grade or the final exam grade? Select the correct answer below: A. The absolute value of the z-score for the final exam grade is greater than for the midterm grade, so the final exam grade is more unusual. B. The absolute value of the z-score for the midterm exam grade is less than for the final grade, so the midterm grade is more unusual. C. The absolute value of the z-score for the midterm exam grade is greater than for the final grade, so the midterm grade is more…arrow_forwardDraw a box plot for the data set with the statistics in the picturearrow_forwardDraw the box-and-whisker plot and give the five-number summary for each data set. Number of games won by the Detroit Lions in their last 10 seasons: minumim:________ (9,7,11,7,4,10,6,2,0,7) Lower Quartile:________ Median:______________ Upper Quartile:_____________ Maximum_______________arrow_forward
- Data was collected for a sample of 7 organic snacks. The amount of sugar (in mg) in each snack is summarized in the histogram below. Snack Graph 12+ 10- 24 Snacks What is the sample size for this data set?arrow_forwardprovide an interpretation of the the plots presented here. what do you learn about the data distribution? do any possible concerns emerge? Then, in two paragraphs, continue with an elaboration on the controlling idea, perhaps with an explanation, implication, or statement about significance.arrow_forwardComment on one aspect of the comparison of data from the twodatasets that can be seen more easily on the histograms than onthe boxplots.arrow_forward
- Consider the following ordered data. 6 9 9 10 11 11 12 13 14 Find the low, Q1, median, Q3, and high.arrow_forwardTornadoes The following data represent the width (inyards) and length (in miles) of tornadoes.Width (yards), w Length (miles), L200 2.5350 4.8180 2.0300 2.5500 5.8400 4.5500 8.0800 8.0100 3.450 0.5700 9.0600 5.7Source: NOAA(a) Draw a scatter diagram of the data, treating width as theindependent variable.(b) What type of relation appears to exist between the widthand the length of tornadoes?(c) Select two points and find a linear model that containsthe points.(d) Graph the line on the scatter diagram drawn in part (b).(e) Use the linear model to predict the length of a tornadothat has a width of 450 yards.(f) Interpret the slope of the line found in part (c).arrow_forwardConsider the following ordered data. 4 7 7 8 9 9 10 11 12 (a) Find the low, Q1, median, Q3, and high.arrow_forward
 MATLAB: An Introduction with ApplicationsStatisticsISBN:9781119256830Author:Amos GilatPublisher:John Wiley & Sons Inc
 Probability and Statistics for Engineering and th...StatisticsISBN:9781305251809Author:Jay L. DevorePublisher:Cengage Learning
 Statistics for The Behavioral Sciences (MindTap C...StatisticsISBN:9781305504912Author:Frederick J Gravetter, Larry B. WallnauPublisher:Cengage Learning
 Elementary Statistics: Picturing the World (7th E...StatisticsISBN:9780134683416Author:Ron Larson, Betsy FarberPublisher:PEARSON
 The Basic Practice of StatisticsStatisticsISBN:9781319042578Author:David S. Moore, William I. Notz, Michael A. FlignerPublisher:W. H. Freeman
 Introduction to the Practice of StatisticsStatisticsISBN:9781319013387Author:David S. Moore, George P. McCabe, Bruce A. CraigPublisher:W. H. Freeman


