
A First Course in Probability (10th Edition)
10th Edition
ISBN: 9780134753119
Author: Sheldon Ross
Publisher: PEARSON
expand_more
expand_more
format_list_bulleted
Related questions
Question
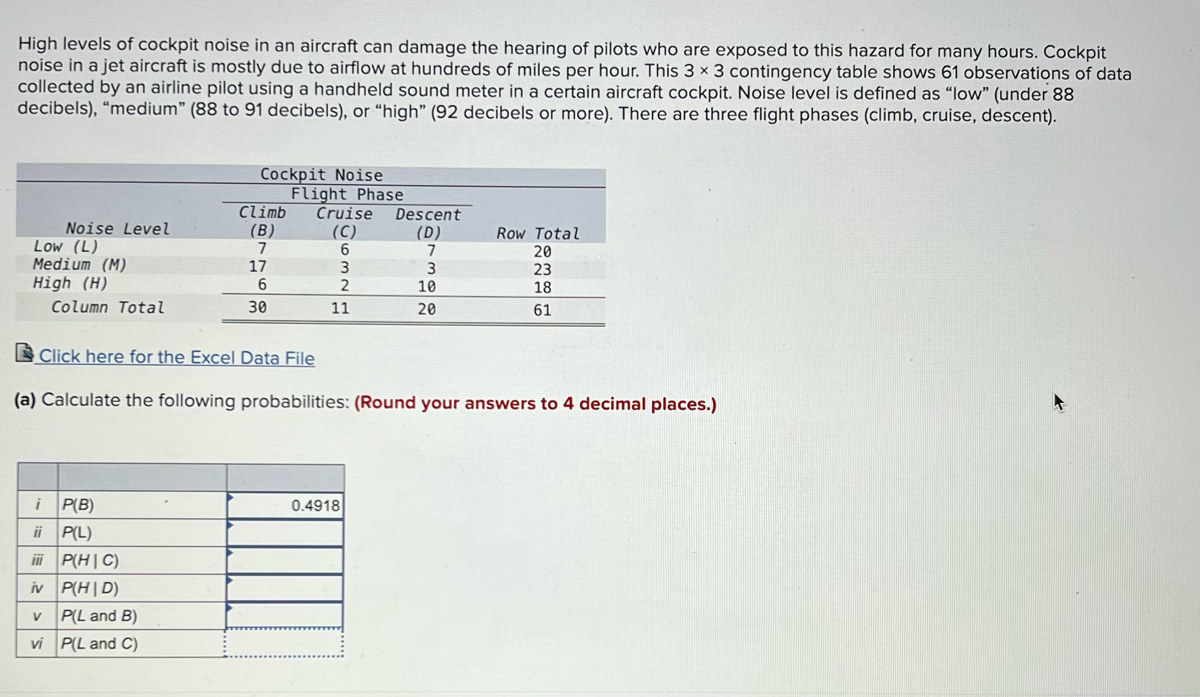

Transcribed Image Text:High levels of cockpit noise in an aircraft can damage the hearing of pilots who are exposed to this hazard for many hours. Cockpit
noise in a jet aircraft is mostly due to airflow at hundreds of miles per hour. This 3 x 3 contingency table shows 61 observations of data
collected by an airline pilot using a handheld sound meter in a certain aircraft cockpit. Noise level is defined as "low" (under 88
decibels), "medium" (88 to 91 decibels), or "high" (92 decibels or more). There are three flight phases (climb, cruise, descent).
Noise Level
Low (L)
Medium (M)
High (H)
Column Total
Cockpit Noise
i P(B)
ii P(L)
iii P(H|C)
iv P(HID)
v P(L and B)
vi P(L and C)
Climb
(B)
7
17
6
30
Flight Phase
Cruise Descent
(C)
(D)
6
7
3
3
2
11
10
20
Click here for the Excel Data File
(a) Calculate the following probabilities: (Round your answers to 4 decimal places.)
0.4918
Row Total
20
23
18
61
Expert Solution
This question has been solved!
Explore an expertly crafted, step-by-step solution for a thorough understanding of key concepts.

This is a popular solution

Trending nowThis is a popular solution!

Step by stepSolved in 3 steps with 19 images

Knowledge Booster

Similar questions
- Now consider a bag of ten colorful marbles. You reach into the bag 100 times. Each time you pull out a marble, write down what color it was, then put it back in the bag and do it again. You record the following data: Table describing marble frequency Color Frequency Red 22 Yellow 9 Green 41 Blue 28 • What was the relative frequency of reach color? Explain. 1°arrow_forwardData was collected for 300 fish from the North Atlantic. The length of the fish (in mm) is summarized in the GFDT below. Lengths (mm) Frequency 140 - 143 1 144 - 147 16 148 - 151 71 152 - 155 108 156 - 159 83 160 - 163 18 164 - 167 3 What is the lower class boundary for the first class?arrow_forwardA professor records the following final grades in one course. Construct a frequency table for the grades. B B B B C C D D F A A A A с с с с с D BD Complete the table. (Type an integer or decimal rounded to the nearest tenth as needed.) Grade Frequency Relative frequency Cumulative frequency rarrow_forward
- Data was collected for 300 fish from the North Atlantic. The length of the fish (in mm) is summarized in the GFDT below. Lengths (mm) Frequency 80 - 84 1 85 - 89 16 90 - 94 71 95 - 99 108 100 - 104 83 105 - 109 18 110 - 114 3 What is the lower class limit for the fourth class?lower class limit =arrow_forwardLast year, 9 employees of an electronics company retired. Their ages al retirement are given in the frequency lable below. Find the median retirement age. Age f 70 1. 65 3. 60 55 0. 50 2. N= 9 O 62 O 55 O 60 0 5arrow_forwardPlease answer all these questions and label, data included: Size($) Rent(sq.feet) 850 1950 1450 2600 1085 2200 1232 2500 718 1950 1485 2700 1136 2650 726 1935 700 1875 956 2150 1100 2400 1285 2650 1985 3300 1369 2800 1175 2400 1225 2450 1245 2100 1259 2700 1150 2200 896 2150 1361 2600 1040 2650 755 2200 1000 1800 1200 2750 A real estate agent wishes to examine the relationship between the selling price of a home (measured in thousands of dollars) and its size (measured in square feet). In particular she wants to assess if the size of the home can accurately predict the house’s selling price. Use the sample data in the RENT spreadsheet to answer the following questions about the relationship. Which characteristic is the dependent variable? Y = Which characteristic is the independent variable? X = Create a scatter plot for the data set. What does this tell you about the relationship between the variables? 4. What are the…arrow_forward
- The energy consumption of a group of studio condos is stated below. One set of condos is facing the sun while the other set is not. Determine the interquartile range in each data set and analyze the differences in context. Be sure to show all equations and calculations used. Answer in complete sentences. Facing the sun (kilowatt hours per month): 850, 700, 450, 320, 900, 1500, 456, 742, 753, 854, 1000, 547, 865 Not facing the sun (kilowatt hours per month): 950, 750, 525, 410, 990, 1640, 556, 842, 853, 954, 1150, 647, 965arrow_forwardA bike sharing program recorded meteorological factors as part of efforts to understand factors related to bike usage on Sundays. The bike usage and the average temperature (Temp below, in degrees Celsius) on 12 consecutive Sundays is provided below. Usage Temp 2586 6.2 2886 5.3 3850 10.3 7.2 9.8 9.3 17.6 14.7 15.4 3352 3842 3665 4592 4409 4562 <arrow_forwardThe cholesterol levels (in milligrams per deciliter) of 30 adults are listed below. Find the interquartile range for the cholesterol level of the 30 adults. 172 180 184 185 154 156 165 165 170 171 189 189 190 192 195 198 198 200 200 200 205 205 211 215 220 220 225 238 255 265 OA. 180 B. 30 O O O C. 31 O D. 211arrow_forward
- Data was collected for a sample of organic snacks. The amount of sugar (in mg) in each snack is summarized in the histogram below. Which statement best describes the meaning of one of the bars in the histogram? Frequency 14 12 10 8 140 150 160 170 180 190 200 210 amount of sugar (mg) The largest number of snacks have 14 mg of sugar 3 snacks have about 145 mg of sugar. 145 snacks have between 140 and 150 mg of sugar. O 145 snacks have 3 mg of sugar.arrow_forwardA professor records the following final grades in one course. Construct a frequency table for the gradies. B B BBB Ce с с с с CDD D D F Complete the tabla. (Type an integer or decimal rounded to the nearest tonth as nooded.) Grade Frequency Rointive frequenoy Cumulative frequency CC TF B B с с % 1=10%arrow_forwardThe accompanying histogram is for pulse rates for 125 people. Convert the vertical axis to relative frequency and shows the values that would replace each of the values on the vertical axis.arrow_forward
arrow_back_ios
SEE MORE QUESTIONS
arrow_forward_ios
Recommended textbooks for you
- A First Course in Probability (10th Edition)ProbabilityISBN:9780134753119Author:Sheldon RossPublisher:PEARSON

A First Course in Probability (10th Edition)
Probability
ISBN:9780134753119
Author:Sheldon Ross
Publisher:PEARSON