MATLAB: An Introduction with Applications
6th Edition
ISBN: 9781119256830
Author: Amos Gilat
Publisher: John Wiley & Sons Inc
expand_more
expand_more
format_list_bulleted
Concept explainers
Topic Video
Question

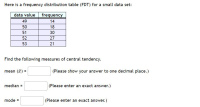
Transcribed Image Text:Here is a frequency distribution table (FDT) for a small data set:
frequency
14
data value
49
50
18
51
30
52
27
53
21
Find the following measures of central tendency.
Expert Solution
This question has been solved!
Explore an expertly crafted, step-by-step solution for a thorough understanding of key concepts.
This is a popular solution
Trending nowThis is a popular solution!
Step by stepSolved in 2 steps

Knowledge Booster
Learn more about
Need a deep-dive on the concept behind this application? Look no further. Learn more about this topic, statistics and related others by exploring similar questions and additional content below.Similar questions
- Use the hourly rates on the right (rounded to the nearest whole dollar) for 35 support employees in a private college to complete the frequency distribution and find the grouped mean. Complete the class frequency table below. Class interval 6-10 11-15 16-20 21-25 26-30 Total Class frequency ☐☐☐☐☐☐ Midpoint 8 13 18 23 28 $15 $25 $15 $17 $25 $15 $7 $10 $7 $13 $13 $18 $17 $16 $15 $7. $16 $18 $24 $19 $17 $15 $12 $29 $10 $11 $27 $17 $12 $13 $12 $14 $11 $12 $8arrow_forwardConstruct a frequency distribution and a relative frequency histogram for the data set using five classes. Which class has the greatest relative frequency and which has the least relative frequency? Class 11 Ratings from 1 (lowest) to 10 (highest) from 36 taste testers 2 5 9 73 ... 85 54 1 5 56 7 3 3 5 10 9 9 1 6 2 6 2 Construct a frequency distribution for the data using five classes. Frequency 6 4 4 10 9 4 9 6 9 3 1 2arrow_forwardHere is a frequency distribution for a small data set: data freq 28 29 30 31 32 Find the following measures of central tendency. mean = median = mode = Add Work 3 3 3 3 8 > Next Questionarrow_forward
- Complete the following frequency chart.A frequency chart of temperatures Temperature Frequency Relative Frequency 70 - 74 75 - 79 80 - 84 85 - 89 90 - 94 From the frequency chart, calculate the mean. How does the mean from the raw data (question 7) compare to the mean from the grouped data (question 9)? Use the frequency chart to create a histogram of the daily high temperatures at Cox-Dayton International Airport for June and July 2018. Describe the distribution by shape, center, and spread. Also, state whether there are any outliers.arrow_forwardThe following is a frequency histogram and a box plot showing the annual salary distribution at a small company. 2- 30 40 50 60 70 80 90 100 110 120 130 140 150 Annual Salary (in thousands of $) Number of Employees 4.arrow_forward
arrow_back_ios
arrow_forward_ios
Recommended textbooks for you
 MATLAB: An Introduction with ApplicationsStatisticsISBN:9781119256830Author:Amos GilatPublisher:John Wiley & Sons Inc
 Probability and Statistics for Engineering and th...StatisticsISBN:9781305251809Author:Jay L. DevorePublisher:Cengage Learning
 Statistics for The Behavioral Sciences (MindTap C...StatisticsISBN:9781305504912Author:Frederick J Gravetter, Larry B. WallnauPublisher:Cengage Learning
 Elementary Statistics: Picturing the World (7th E...StatisticsISBN:9780134683416Author:Ron Larson, Betsy FarberPublisher:PEARSON
 The Basic Practice of StatisticsStatisticsISBN:9781319042578Author:David S. Moore, William I. Notz, Michael A. FlignerPublisher:W. H. Freeman
 Introduction to the Practice of StatisticsStatisticsISBN:9781319013387Author:David S. Moore, George P. McCabe, Bruce A. CraigPublisher:W. H. Freeman

MATLAB: An Introduction with Applications
Statistics
ISBN:9781119256830
Author:Amos Gilat
Publisher:John Wiley & Sons Inc

Probability and Statistics for Engineering and th...
Statistics
ISBN:9781305251809
Author:Jay L. Devore
Publisher:Cengage Learning

Statistics for The Behavioral Sciences (MindTap C...
Statistics
ISBN:9781305504912
Author:Frederick J Gravetter, Larry B. Wallnau
Publisher:Cengage Learning

Elementary Statistics: Picturing the World (7th E...
Statistics
ISBN:9780134683416
Author:Ron Larson, Betsy Farber
Publisher:PEARSON

The Basic Practice of Statistics
Statistics
ISBN:9781319042578
Author:David S. Moore, William I. Notz, Michael A. Fligner
Publisher:W. H. Freeman

Introduction to the Practice of Statistics
Statistics
ISBN:9781319013387
Author:David S. Moore, George P. McCabe, Bruce A. Craig
Publisher:W. H. Freeman