MATLAB: An Introduction with Applications
6th Edition
ISBN: 9781119256830
Author: Amos Gilat
Publisher: John Wiley & Sons Inc
expand_more
expand_more
format_list_bulleted
Question

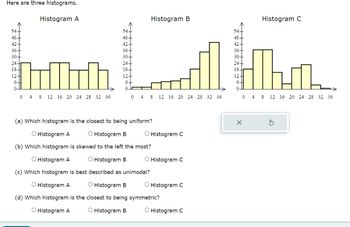
Transcribed Image Text:Here are three histograms.
Histogram C
54.
48-
Histogram A
Histogram B
54-
54-
48-
48-
42-
42-
36-
36-
30+
30-
24-
24-
18+
18-
12-
12-
12
6
6+
6-
0-
0-
0 4 8 12 16 20 24 28 32 36
0
4
8
12 16 20 24 28 32 36
42-
36-
30-
24-
18-
ΗΠ
0 4 8 12 16 20 24 28 32 36
(a) Which histogram is the closest to being uniform?
☑
○ Histogram B
○ Histogram C
○ Histogram A
(b) Which histogram is skewed to the left the most?
Histogram A
Histogram B
(c) Which histogram is best described as unimodal?
O Histogram A
Histogram B
Histogram C
Histogram C
(d) Which histogram is the closest to being symmetric?
Histogram A
O Histogram B
◇ Histogram C
Expert Solution
This question has been solved!
Explore an expertly crafted, step-by-step solution for a thorough understanding of key concepts.
Step by stepSolved in 2 steps

Knowledge Booster
Similar questions
- K Listed below are altitudes (in thousands of feet) and outside air temperatures (in °F) recorded during a flight between two cities. A. Altitude Temperature Use these data to complete parts (a) through (d) below. A Temp. 60- -60- a. Construct a scatterplot. Choose the correct answer below. O -O | O O strong O b p 3 56 Alt. 410 9 39 weak positive correlation strong negative correlation 13 26 strong positive correlation O weak negative correlation B. 23 - 6 A Temp. 60- -60- 26 - 30 O O -O- 32 - 42 Alt. 40 b. Briefly characterize the correlation in words. Choose the correct answer below. 33 - 52 h .. O C. 60- -60- Temp. O 10 O O Alt. 40 SO D. A Temp. O 60- -60- O O O O Alt. 40arrow_forwardPearson’s r can also be considered as: Group of answer choices a measure of how much values differ in a sample. the size of a typical value. the number of independent pieces of information. a measure of covariance.arrow_forwardThe variable week# is at what level of measurementarrow_forward
- Options for each answer are listedarrow_forward2 The data set below is used for questions 1-3. The times for 35 students to take a final exam (in hours) are listed below: The data is listed in rows with 5 values each, just for your convenience in reading them. There is nothing special about the groupings. 0.2, 0.5, 0.7, 1.1, 1.2, 1.2, 1.3, 1.4, 1.4, 1.4, 1.5, 1.5, 1.6, 1.6, 1.7, 1.9, 2.0, 2.1, 2.1, 2.2, 2.3, 2.5, 2.6, 2.8, 2.9, 3.0, 3.0, 3.1, 3.7, 3.7, 4.0, 4.1, 4.5, 5.1, 5.8 Which distribution might be appropriate for this data? For the instructor, this was question 3. X Binomial X Exponential / Gamma X Negative binomial X Normal X Poissonarrow_forwardHow will do simple correlation using data shown in R? Thanks.arrow_forward
- 1.16 Income and education in US counties: The scatterplot below shows the relationship between per capita income (in thousands of dollars) and percent of population with a bachelor's degree in 3,143 counties in the US in 2010. Per capita income (in $1,000) 60- 40 20 10 30 Percent with Bachelor's degree a) What is the explanatory variable? Percent with a Bachelor's Degree Per Capita Income (in $1000s) b) What is the response variable? Per Capita Income (in $1000s) Percent with a Bachelor's Degree 50 c) Describe the relationship between the variables. no relationship weak negative strong negative weak positive strong positive 70arrow_forwardConstruct a dotplot for the given data. 1.2, 1.0, 0.8, 0.9, 0.8. 0.8, 1.1, 1.0, 2.1, 1.3, 0.9, 0.8, 0.8, 0.9, 0.9 L USE SALT 00.5 1.0 1.5 2.0 2.5 1.0 1.5 2.0 005 2.5 00.5 1.0 1.5 2.0 2.5 00.5 1.0 1.5 2.0 2.5 Describe the shape of the distribution and look for any outliers. O The data is skewed left with one unusually small outlier. O The data is skewed left with no obvious outliers. O The data is skewed right with one unusually large outlier O The data is mound shaped with no obvious outliers. O The data is mound shaped with one unusually smal and one unu usually large outlienarrow_forward_______________ is the ability to detect a significant difference or relationship and is influenced by several different factors including __________ (name one).arrow_forward
arrow_back_ios
arrow_forward_ios
Recommended textbooks for you
 MATLAB: An Introduction with ApplicationsStatisticsISBN:9781119256830Author:Amos GilatPublisher:John Wiley & Sons Inc
 Probability and Statistics for Engineering and th...StatisticsISBN:9781305251809Author:Jay L. DevorePublisher:Cengage Learning
 Statistics for The Behavioral Sciences (MindTap C...StatisticsISBN:9781305504912Author:Frederick J Gravetter, Larry B. WallnauPublisher:Cengage Learning
 Elementary Statistics: Picturing the World (7th E...StatisticsISBN:9780134683416Author:Ron Larson, Betsy FarberPublisher:PEARSON
 The Basic Practice of StatisticsStatisticsISBN:9781319042578Author:David S. Moore, William I. Notz, Michael A. FlignerPublisher:W. H. Freeman
 Introduction to the Practice of StatisticsStatisticsISBN:9781319013387Author:David S. Moore, George P. McCabe, Bruce A. CraigPublisher:W. H. Freeman

MATLAB: An Introduction with Applications
Statistics
ISBN:9781119256830
Author:Amos Gilat
Publisher:John Wiley & Sons Inc

Probability and Statistics for Engineering and th...
Statistics
ISBN:9781305251809
Author:Jay L. Devore
Publisher:Cengage Learning

Statistics for The Behavioral Sciences (MindTap C...
Statistics
ISBN:9781305504912
Author:Frederick J Gravetter, Larry B. Wallnau
Publisher:Cengage Learning

Elementary Statistics: Picturing the World (7th E...
Statistics
ISBN:9780134683416
Author:Ron Larson, Betsy Farber
Publisher:PEARSON

The Basic Practice of Statistics
Statistics
ISBN:9781319042578
Author:David S. Moore, William I. Notz, Michael A. Fligner
Publisher:W. H. Freeman

Introduction to the Practice of Statistics
Statistics
ISBN:9781319013387
Author:David S. Moore, George P. McCabe, Bruce A. Craig
Publisher:W. H. Freeman