MATLAB: An Introduction with Applications
6th Edition
ISBN: 9781119256830
Author: Amos Gilat
Publisher: John Wiley & Sons Inc
expand_more
expand_more
format_list_bulleted
Question
Hello!
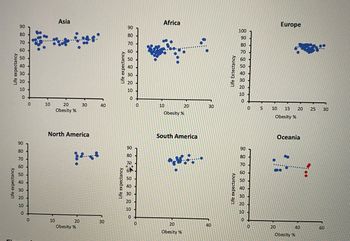
Please look at the image attached. There are 6 correlation scatter graphs which each represents a continent. Please analyse the graphs, as what they indicate and what they show as in the relationship between obesity% and life expectancy.
Thank you

Transcribed Image Text:Life expectancy
Life expectancy
O
Asia
Obesity %
North America
10
20
Obesity %
30
Life expectancy
Life expectancy
Africa
O
30
61%
0
10
Obesity %
South America
20
Obesity %
40
Life Extectancy
Life expectancy
O
S
Europe
Pg
10 15
Obesity %
20
Oceania
Co
20 25 30
40
Obesity %
8
60
Expert Solution
This question has been solved!
Explore an expertly crafted, step-by-step solution for a thorough understanding of key concepts.
Step by stepSolved in 2 steps

Knowledge Booster
Similar questions
- Mrs. Kelley noticed a strong positive correlation between the hours students said that they studied for a test and their scores on the test. Which fact would lead you to believe that the relationship between studying and test scores is one of causation and not correlation?arrow_forwardCorrelation does not imply causation. What does this mean? Find an example in the media that needs to understand this concept and explain it to your peers. Be sure to include the link to the example you are using.arrow_forwardSummarize the definitions for linear correlation, quadratic correlations and exponential correlations. Provide an example graph of each of the types of correlation along with your summarized definitions.arrow_forward
- The table pertains to scheduled commercial carriers. Fatalities data include those on the ground except for the September 11, 2001, terrorist attacks. Use this information given in the table. For fatalities the mean an = 66.7 the median = 14.5 and the mode = 2 2. The year 2001 was clearly an anomaly. If the data for that year is reduced by 239 fatalities, which of the three measures change and what are their new values for each of the following? please help:(arrow_forwardSuppose the correlation between height and weight for adults is +0.40.What proportion (or percent) of the variability in weight can be explained by the relationship with height?arrow_forwardDescribe how correlation and regression are linked yet distinct.arrow_forward
- Hello! Please analyse the table 3 and 4 in the image attached. the data is supposed to see if there is a relationship between the prevalence of obesity(table3) or life expectancy (table4) between males and females. thank you!arrow_forwardIn your own words, explain three differences between correlation and regression analysisarrow_forwardPlease anwser using SPSS!arrow_forward
arrow_back_ios
SEE MORE QUESTIONS
arrow_forward_ios
Recommended textbooks for you
 MATLAB: An Introduction with ApplicationsStatisticsISBN:9781119256830Author:Amos GilatPublisher:John Wiley & Sons Inc
 Probability and Statistics for Engineering and th...StatisticsISBN:9781305251809Author:Jay L. DevorePublisher:Cengage Learning
 Statistics for The Behavioral Sciences (MindTap C...StatisticsISBN:9781305504912Author:Frederick J Gravetter, Larry B. WallnauPublisher:Cengage Learning
 Elementary Statistics: Picturing the World (7th E...StatisticsISBN:9780134683416Author:Ron Larson, Betsy FarberPublisher:PEARSON
 The Basic Practice of StatisticsStatisticsISBN:9781319042578Author:David S. Moore, William I. Notz, Michael A. FlignerPublisher:W. H. Freeman
 Introduction to the Practice of StatisticsStatisticsISBN:9781319013387Author:David S. Moore, George P. McCabe, Bruce A. CraigPublisher:W. H. Freeman

MATLAB: An Introduction with Applications
Statistics
ISBN:9781119256830
Author:Amos Gilat
Publisher:John Wiley & Sons Inc

Probability and Statistics for Engineering and th...
Statistics
ISBN:9781305251809
Author:Jay L. Devore
Publisher:Cengage Learning

Statistics for The Behavioral Sciences (MindTap C...
Statistics
ISBN:9781305504912
Author:Frederick J Gravetter, Larry B. Wallnau
Publisher:Cengage Learning

Elementary Statistics: Picturing the World (7th E...
Statistics
ISBN:9780134683416
Author:Ron Larson, Betsy Farber
Publisher:PEARSON

The Basic Practice of Statistics
Statistics
ISBN:9781319042578
Author:David S. Moore, William I. Notz, Michael A. Fligner
Publisher:W. H. Freeman

Introduction to the Practice of Statistics
Statistics
ISBN:9781319013387
Author:David S. Moore, George P. McCabe, Bruce A. Craig
Publisher:W. H. Freeman