
MATLAB: An Introduction with Applications
6th Edition
ISBN: 9781119256830
Author: Amos Gilat
Publisher: John Wiley & Sons Inc
expand_more
expand_more
format_list_bulleted
Related questions
Question
thumb_up100%
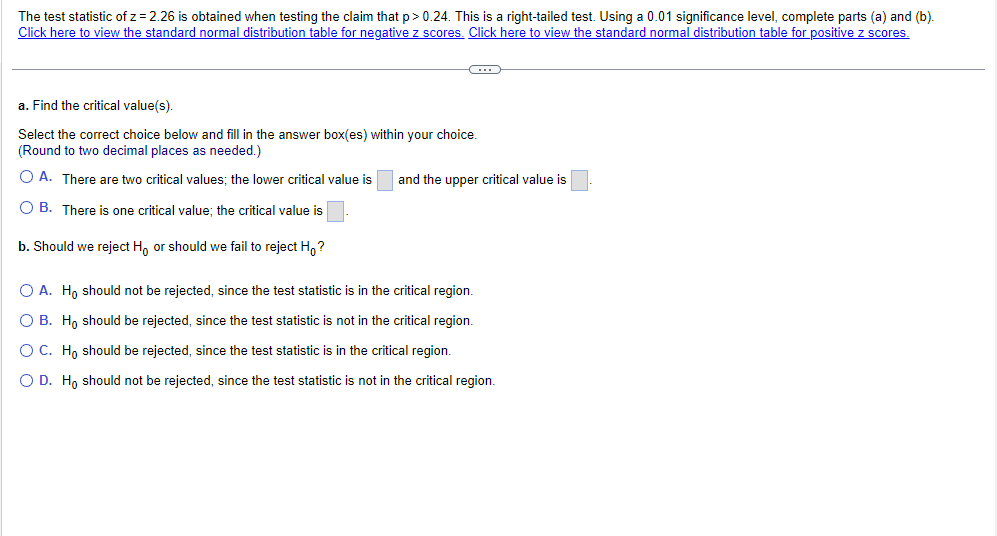

Transcribed Image Text:The test statistic of z = 2.26 is obtained when testing the claim that p > 0.24. This is a right-tailed test. Using a 0.01 significance level, complete parts (a) and (b).
Click here to view the standard normal distribution table for negative z scores. Click here to view the standard normal distribution table for positive z scores.
C
a. Find the critical value(s).
Select the correct choice below and fill in the answer box(es) within your choice.
(Round to two decimal places as needed.)
OA. There are two critical values; the lower critical value is
O B. There is one critical value; the critical value is
b. Should we reject Ho or should we fail to reject Ho?
and the upper critical value is
O A. Ho should not be rejected, since the test statistic is in the critical region.
O B. Ho should be rejected, since the test statistic is not in the critical region.
O C. Ho should be rejected, since the test statistic is in the critical region.
O D. Ho should not be rejected, since the test statistic is not in the critical region.

Transcribed Image Text:00
0.1
0.2
03
0.5
0.6
0.7
08
09
1.0
1.1
1.2
13
1.4
1.5
16
13
1.8
1.9
2.0
2.1
22
2.3
2.4
25
2.6
2.7
2.8
2.9
3.0
3.1
3.2
3.3
3.4
3.50 and up
7580
8159
3413
3643
8849
Standard Normal (z) Distribution: Cumulative Area from the LEFT
.00
02
5000
5080
5338
5478
5793
5871
6179
6255
6554
6428
8915
2006
3192
9332
9452
9554
9713
9772
3421
3861
9893
.9918
9938
9953
3965
9974
9961
9987
3900
9993
9995
0
9997
3000
.00
z
01
5040
5438
5832
6217
6591
6960
3291
3611
7910
9019
8665
9049
3007
9345
9463
9719
9778
9864
9686
9920
9940
9975
9982
9987
9993
9995
9997
01
.7324
7642
7939
4212
8461
8686
8888
9066
9222
2906
9474
9573
.9656
9726
9783
9430
.9656
.9922
9941
9956
9067
.9676
9942
9987
9964
9995
9967
POSITIVE z Scores
02
5120
5617
5910
3019
3257
7673
7967
8435
8708
8907
2006
9370
9434
9582
9664
9732
9788
9834
9901
9925
9943
9957
9968
.9977
.9983
1166
1866
9994
9666
9997
03
5160
5557
5848
6331
6700
3389
7704
.7995
8264
.8506
8729
8925
9000
9382
9495
$691
9671
9738
9793
1675
9904
9927
9945
9960
9677
9964
2006
9994
9997
.04
5199
5506
5987
6368
6736
7088
37734
8023
3209
8531
8749
8944
9115
90005
9394
9505
9599
9678
9744
9798
9842
9878
9906
9929
.9946
9960
9970
9978
9934
6066
9902
9994
9666
9997
05
5239
5636
6026
6406
6772
7123
7454
7764
8051
8564
8770
9131
6.005
9406
9615
9608
9686
9750
9603
9046
9909
9931
9940
9979
9909
9994
9996
9997
.06
037
5279
5675
6064
6443
6808
7157
2436
7794
8078
8577
8790
0868
9147
3292
9418
9525
9616
9003
.9756
9808
9850
3884
9911
9932
3949
2966
.:9972
9979
9985
9909
3902
.9995
9997
.07
00
5319
5714
6103
6480
3190
8106
8810
8997
9162
9005
9429
9699
9761
9812
9913
9934
9963
9973
9980
9990
9995
9997
08
60
5359
5753
6141
6517
6879
7224
7549
7852
8389
8621
8830
9015
9177
3019
9441
9545
9633
3706
.9767
9817
9857
9916
9936
9962
9964
3974
9561
9966
9990
3003
9996
09
Expert Solution
This question has been solved!
Explore an expertly crafted, step-by-step solution for a thorough understanding of key concepts.

This is a popular solution

Trending nowThis is a popular solution!

Step by stepSolved in 2 steps with 1 images

Knowledge Booster

Similar questions
- Complete parts (a) and (b) below. Click here to view Page 1 of the table of areas under the standard normal curve. Click here to view Page 2 of the table of areas under the standard normal curve. a. The test statistic in a right-tailed test is z= 1.71. Determine the P-value and decide whether, at the 5% significance level, the data provide sufficient evidence to reject the null hypothesis in favor of the alternative hypothesis. The P-value is (Round to three decimal places as needed.) This P-value V sufficient evidence to reject the null hypothesis in favor of the alternative hypothesis because it is V the significance level. b. The test statistic in a right-tailed test is z= - 0.82. Determine the P-value and decide whether, at the 5% significance level, the data provide sufficient evidence to reject the null hypothesis in favor of the alternative hypothesis. The P-value is (Round to three decimal places as needed.) This P-value sufficient evidence to reject the null hypothesis in…arrow_forwardFind the percent of the total area under the standard normal curve between the following z-scores. zequals=0.75 and zequals=1.2 The percent of the total area between zequals=0.75 and zequals=1.2 is enter your response here%. (Round to the nearest integer.)arrow_forwardPlease help with B and Carrow_forward
- Assume the samples are random and independent, the populations are nomally distributed, and the population variances are equal. The table available below shows the prices (in dollars) for a sample of automobile batteries. The prices are classified according to battery type. At a = 0.10, is there enough evidence conclude that at least one mean battery price is different from the others? Complete parts (a) through (e) below. E Click the icon to view the battery cost data. (a) Let u1. P2. H3 represent the mean prices for the group size 35, 65, and 24/24F respectively. Identify the claim and state Ho and H. H Cost of batteries by type The claim is the V hypothesis. Group size 35 Group size 65 Group size 24/24F 101 111 121 124 D 146 173 182 278 124 140 141 89 (b) Find the critical value, Fo, and identify the rejection region. 90 79 84 The rejection region is F Fo, where Fo = (Round to two decimal places as needed.) (c) Find the test statistic F. Print Done F= (Round to two decimal places as…arrow_forwardThe test statistic of z=0.91 is obtained when testing the claim that p>0.29. This is a right-tailed test. Using a 0.10 significance level, complete parts (a) and (b). Click here to view the standard normal distribution table for negative z scores. Click here to view the standard normal distribution table for positive z scores. a. Find the critical value(s). Select the correct choice below and fill in the answer box(es) within your choice. (Round to two decimal places as needed.) OA. There are two critical values; the lower critical value is B. There is one critical value; the critical value is and the upper critical value isarrow_forwardThe height of women ages 20-29 is normally distributed, with a mean of 63.6 inches. Assume o = 2.5 inches. Are you more lrely to randomly select 1 woman with a height less than 64.1 inches or are you more likely to select a sample of 20 women with a mean height less than 64.1 inches? Explain. E Click the icon to view page 1 of the standard normal table. E Click the icon to view page 2 of the standard normal table. What is the probability of randomly selecting 1 woman with a height less than 64.1 inches? (Round to four decimal places as needed.) Enter your answer in the answer box and then click Check Answer. Check Answer Clear All parts 2 Femainingarrow_forward
- The test statistic of z = -2.13 is obtained when testing the claim that p<0.15. a. Using a significance level of a = 0.01, find the critical value(s). b. Should we reject Ho or should we fail to reject Ho? Click here to view page 1 of the standard normal distribution table. Click here to view page 2 of the standard normal distribution table. Standard normal distribution table (page 1) a. The critical value(s) is/are z = (Round to two decimal places as needed. Use a comma to separate answers as needed.) NEGATIV E z Scores Standard Normal (2) Distribution: Cumulative Area from the LEFT 01 .02 03 04 05 06 07 08 09 -3.50 and 0001 lower -3.4 0003 .0003 0003 0003 0003 0003 .0003 .0003 0003 .0002 -3.3 0005 0005 0004 0004 .0004 0004 0004 0004 .0003 -3.2 0007 0007 0006 0006 0006 0006 0006 .0005 .0005 .0005 -3.1 0010 0009 0009 0009 0008 0008 .0008 0008 .0007 .0007 -3.0 0013 0013 0013 0012 0012 .0011 0011 .0011 .0010 .0010 -2.9 0019 0018 0018 0017 0016 0016 0015 0015 .0014 0014 -2.8 0026 0025…arrow_forwardAnswer the last questionarrow_forwardWhat are the values for SS and variance for the following sample of n = 3 scores? Sample: 8, 5, 2arrow_forward
- kshe The height of women ages 20-29 is normally distributed, with a mean of 64.6 inches. Assume o = 2.9 inches. Are you more likely to randomly select 1 woman with a e score les (fo height less than 66.4 inches or are you more likely to select a sample of 30 women with a mean height less than 66.4 inches? Explain. E . Click the icon to view page 1 of the standard normal table. signme ee score A Click the icon to view page 2 of the standard normal table. radeboc What is the probability of randomly selecting 1 woman with a height less than 66.4 inches? e score mail O (Round to four decimal places as needed.) What is the probability of selecting a sample of 30 women with a mean height less than 66.4 inches? Text (Round to four decimal places as needed.) Accessibl Resource Are you more likely to randomly select 1 woman with a height less than 66.4 inches or are you more likely to select a sample of 30 women with a mean height less than 66.4 inches? Choose the correct answer below. Tools…arrow_forwardA 0.1 significance level is used for a hypothesis test of the claim that when parents use a particular method of gender selection, the proportion of baby girls is less than 0.5. Assume that sample data consists of 78 girls in 169 births, so the sample statistic of 613 results in a z score that is 1 standard deviation below 0. Complete parts (a) through (h) below.Click here to view page 1 of the Normal table. LOADING... Click here to view page 2 of the Normal table. LOADING...Question content area bottomPart 1a. Identify the null hypothesis and the alternative hypothesis. Choose the correct answer below.A.H0: p≠0.5H1: p<0.5B.H0: p=0.5H1: p≠0.5C.H0: p=0.5H1: p<0.5D.H0: p=0.5H1: p>0.5Part 2b. What is the value of α?α=enter your response here (Type an integer or a decimal.)Part 3c. What is the sampling distribution of the sample statistic? Normal distribution Student (t) distribution χ2Part 4d. Is the test two-tailed, left-tailed, or right-tailed? Right-tailed…arrow_forwardA 0.01 significance level is used for a hypothesis test of the claim that when parents use a particular method of gender selection, the proportion of baby girls is different from 0.5. Assume that sample data consists of 55 girls in 100 births, so the sample statistic of 1120 results in a z score that is 1 standard deviation above 0. Complete parts (a) through (h) below.Click here to view page 1 of the Normal table. LOADING... Click here to view page 2 of the Normal table. LOADING...Question content area bottomPart 1a. Identify the null hypothesis and the alternative hypothesis. Choose the correct answer below.A.H0: p=0.5H1: p≠0.5B.H0: p=0.5H1: p>0.5C.H0: p=0.5H1: p<0.5D.H0: p≠0.5H1: p=0.5Part 2b. What is the value of α?α=enter your response here (Type an integer or a decimal.)Part 3c. What is the sampling distribution of the sample statistic? χ2 Normal distribution Student (t) distributionarrow_forward
arrow_back_ios
SEE MORE QUESTIONS
arrow_forward_ios
Recommended textbooks for you
- MATLAB: An Introduction with ApplicationsStatisticsISBN:9781119256830Author:Amos GilatPublisher:John Wiley & Sons Inc
 Probability and Statistics for Engineering and th...StatisticsISBN:9781305251809Author:Jay L. DevorePublisher:Cengage Learning
 Statistics for The Behavioral Sciences (MindTap C...StatisticsISBN:9781305504912Author:Frederick J Gravetter, Larry B. WallnauPublisher:Cengage Learning
  Elementary Statistics: Picturing the World (7th E...StatisticsISBN:9780134683416Author:Ron Larson, Betsy FarberPublisher:PEARSON
 The Basic Practice of StatisticsStatisticsISBN:9781319042578Author:David S. Moore, William I. Notz, Michael A. FlignerPublisher:W. H. Freeman
 Introduction to the Practice of StatisticsStatisticsISBN:9781319013387Author:David S. Moore, George P. McCabe, Bruce A. CraigPublisher:W. H. Freeman
MATLAB: An Introduction with Applications
Statistics
ISBN:9781119256830
Author:Amos Gilat
Publisher:John Wiley & Sons Inc
Probability and Statistics for Engineering and th...
Statistics
ISBN:9781305251809
Author:Jay L. Devore
Publisher:Cengage Learning
Statistics for The Behavioral Sciences (MindTap C...
Statistics
ISBN:9781305504912
Author:Frederick J Gravetter, Larry B. Wallnau
Publisher:Cengage Learning
Elementary Statistics: Picturing the World (7th E...
Statistics
ISBN:9780134683416
Author:Ron Larson, Betsy Farber
Publisher:PEARSON
The Basic Practice of Statistics
Statistics
ISBN:9781319042578
Author:David S. Moore, William I. Notz, Michael A. Fligner
Publisher:W. H. Freeman
Introduction to the Practice of Statistics
Statistics
ISBN:9781319013387
Author:David S. Moore, George P. McCabe, Bruce A. Craig
Publisher:W. H. Freeman