
MATLAB: An Introduction with Applications
6th Edition
ISBN: 9781119256830
Author: Amos Gilat
Publisher: John Wiley & Sons Inc
expand_more
expand_more
format_list_bulleted
Related questions
Question
Find the average number of hours per year that families
run their vacuum cleaners and also find the variance
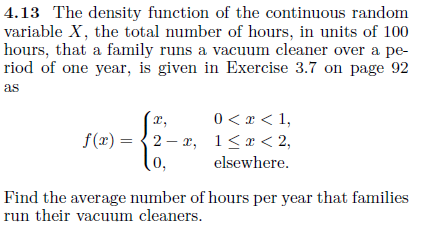

Transcribed Image Text:4.13 The density function of the continuous random
variable X, the total number of hours, in units of 100
hours, that a family runs a vacuum cleaner over a pe-
riod of one year, is given in Exercise 3.7 on page 92
as
0 <x < 1,
f(x) = {2 – x, 1<x< 2,
(0,
elsewhere.
Find the average number of hours per year that families
run their vacuum cleaners.
Expert Solution
This question has been solved!
Explore an expertly crafted, step-by-step solution for a thorough understanding of key concepts.

This is a popular solution

Trending nowThis is a popular solution!

Step by stepSolved in 2 steps with 2 images

Knowledge Booster

Similar questions
- What is the Fratio for these data?arrow_forwardClick this Video for Finding Correlation Coefficient by Using Formula. Yessica thought that there was a correlation between the amount of time students slept the evening before their final exam and their final exam grade. She took an SRS of 5 students in her class and recorded the sleep time the evening before their final exam, and their final exam score. Let the sleep time the evening before the final exam represents the explanatory variable, and the final exam score be the response variable. Below is a sample data set. x (hour) 8 9 3 9 1 2 3 4 5 Calculate the sample correlation coefficient (r) to three decimal places. r= 9 Why would we expect the correlation coefficient to be positive? As the sleep time increases, exam score increases As the sleep time increases, exam score decreases As the sleep time decreases, exam score increases There is no change in exam score to sleep time C E y (score) 91 94 51 100 90 C Aarrow_forwardExplain what restriction of range is and what it tends to do to the magnitude of a correlation.arrow_forward
- A traffic safety company publishes reports about motorcycle fatalities and helmet use. In the first accompanying data table, the distribution shows the proportion of fatalities by location of injury for motorcycle accidents. The second data table shows the location of injury and fatalities for 2061 riders not wearing a helmet. Complete parts (a) and (b) below. Click the icon to view the tables. (a) Does the distribution of fatal injuries for riders not wearing a helmet follow the distribution for all riders? Use α = 0.05 level of significance. What are the null and alternative hypotheses? O A. Ho: The distribution of fatal injuries for riders not wearing a helmet follows the same distribution for all other riders. H₁: The distribution of fatal injuries for riders not wearing a helmet does not follow the same distribution for all other riders. B. Ho: The distribution of fatal injuries for riders not wearing a helmet does not follow the same distribution for all other riders. H₁: The…arrow_forwardSummarize the definitions for linear correlation, quadratic correlations and exponential correlations. Provide an example graph of each of the types of correlation along with your summarized definitions.arrow_forwardA nutritionist collects data from 25 popular breakfast cereals. For each cereal, the number of calories per serving is plotted on the x-axis against the number of milligrams of sodium on the y-axis. The value of r for the resulting scatterplot is 0.83. How would the value of the correlation coefficient, r, change if sodium was plotted on the x-axis and calories plotted on the y-axis? The value of r would increase. The value of r would not change. The value of r would change to –0.83. The value of r could increase or decrease, depending of the strength of the new relationship.arrow_forward
- Suppose data are collected concerning the weight of a person in pounds and the number of calories burned in 30 minutes of walking on a treadmill at 3.5 miles per hour. How would the value of the correlation coefficient, r, change if all of the weights were converted to kilograms?arrow_forwardThe trend of thinner beauty pageant winners has generated charges that the contest encourages unhealthy diet habits among young women. Listed below are body mass indexes (BMI) for beauty pageant winners from two different time periods. Find the coefficient of variation for each of the two sets of data, then compare the variation. BMI (from the 1920s and 1930s): 20.5 21.9 22.1 22.3 20.3 18.7 18.8 19.4 18.3 19.2 BMI (from recent winners): 19.4 20.3 19.6 20.3 17.7 17.9 19.2 18.7 17.7 16.8 The coefficient of variation for the BMI's of beauty pageant winners from the 1920s and 1930s is %. (Round to one decimal place as needed.) The coefficient of variation for the BMI's of recent beauty pageant winners is %. (Round to one decimal place as needed.) Is there a difference in variation between the two data sets? O A. The BMI's of beauty pageant winners from the 1920s and 1930s have considerably less variation than the BMI's of recent winners. O B. The BMI's of recent beauty pageant winners have…arrow_forwardCalculate test statistic Decide whether to reject or fail to rejectarrow_forward
arrow_back_ios
arrow_forward_ios
Recommended textbooks for you
- MATLAB: An Introduction with ApplicationsStatisticsISBN:9781119256830Author:Amos GilatPublisher:John Wiley & Sons Inc
 Probability and Statistics for Engineering and th...StatisticsISBN:9781305251809Author:Jay L. DevorePublisher:Cengage Learning
 Statistics for The Behavioral Sciences (MindTap C...StatisticsISBN:9781305504912Author:Frederick J Gravetter, Larry B. WallnauPublisher:Cengage Learning
  Elementary Statistics: Picturing the World (7th E...StatisticsISBN:9780134683416Author:Ron Larson, Betsy FarberPublisher:PEARSON
 The Basic Practice of StatisticsStatisticsISBN:9781319042578Author:David S. Moore, William I. Notz, Michael A. FlignerPublisher:W. H. Freeman
 Introduction to the Practice of StatisticsStatisticsISBN:9781319013387Author:David S. Moore, George P. McCabe, Bruce A. CraigPublisher:W. H. Freeman
MATLAB: An Introduction with Applications
Statistics
ISBN:9781119256830
Author:Amos Gilat
Publisher:John Wiley & Sons Inc
Probability and Statistics for Engineering and th...
Statistics
ISBN:9781305251809
Author:Jay L. Devore
Publisher:Cengage Learning
Statistics for The Behavioral Sciences (MindTap C...
Statistics
ISBN:9781305504912
Author:Frederick J Gravetter, Larry B. Wallnau
Publisher:Cengage Learning
Elementary Statistics: Picturing the World (7th E...
Statistics
ISBN:9780134683416
Author:Ron Larson, Betsy Farber
Publisher:PEARSON
The Basic Practice of Statistics
Statistics
ISBN:9781319042578
Author:David S. Moore, William I. Notz, Michael A. Fligner
Publisher:W. H. Freeman
Introduction to the Practice of Statistics
Statistics
ISBN:9781319013387
Author:David S. Moore, George P. McCabe, Bruce A. Craig
Publisher:W. H. Freeman