Practical Management Science
6th Edition
ISBN: 9781337406659
Author: WINSTON, Wayne L.
Publisher: Cengage,
expand_more
expand_more
format_list_bulleted
Question
Please answer part h.

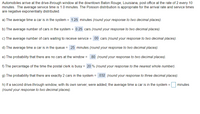
Transcribed Image Text:### Drive-Through Post Office Analysis
Automobiles arrive at the drive-through window at the downtown Baton Rouge, Louisiana, post office at a rate of 2 every 10 minutes. The average service time is 1.0 minute. A Poisson distribution is used to model the arrival rate and service times as they are negatively exponentially distributed.
#### Key Metrics:
a) **Average Time in System:**
- Each car spends an average of **1.25 minutes** in the system.
b) **Average Number of Cars in System:**
- On average, there are **0.25 cars** in the system at any given time.
c) **Average Number of Cars Waiting:**
- The average number of cars waiting for service is **0.00 cars**.
d) **Average Time in Queue:**
- Each car spends an average of **0.25 minutes** in the queue.
e) **Probability of No Cars at Window:**
- There is an **80% probability** that no cars are at the window.
f) **Clerk Busyness:**
- The postal clerk is busy **20%** of the time.
g) **Probability of Exactly 2 Cars in System:**
- There is a **3.2% probability** of having exactly 2 cars in the system.
h) **Impact of Adding a Second Window:**
- If a second drive-through window with its own server was added, determine the average time a car would spend in the system.
These metrics are crucial for optimizing operations and ensuring efficient service at the post office drive-through.
Expert Solution
This question has been solved!
Explore an expertly crafted, step-by-step solution for a thorough understanding of key concepts.
This is a popular solution
Trending nowThis is a popular solution!
Step by stepSolved in 2 steps with 1 images

Knowledge Booster
Similar questions
- The figure below shows the possible routes from city A to city M as well as the cost (in dollars) of a trip between each pair of cities (note that if no arc joins two cities it is not possible to travel non-stop between those two cities). A traveler wishes to find the lowest cost option to travel from city A to city M. 20 16 B 11 21 D E 14 23 14 H 15 14 10 11 K 18 23 21 M Note: This question requires Solver. Formulate the problem in Solver and find the optimal solution. Which of the following nodes are not visited?arrow_forwardPlease do not give solution in image format thankuarrow_forward18 Partial online offers refer to services that cannot be completed without at least one offline step. Select one: a. True b. Falsearrow_forward
- In its new initiatives to improve customer service Botswana Open University intends to adopt theavailable electronic platforms that students can use to pay for their tuition. This requires for theuniversity to inform itself of the available legal ways in the market that a student can use to paythe university.You are therefore required to discuss in detail a presentation to the management of the BotswanaOpen University, the four methods of electronic payment available. This should be illustrated byproviding examples where possible.arrow_forwardWhich of the service gaps do you consider to be most critical, and why?arrow_forward
arrow_back_ios
arrow_forward_ios
Recommended textbooks for you
 Practical Management ScienceOperations ManagementISBN:9781337406659Author:WINSTON, Wayne L.Publisher:Cengage,
 Operations ManagementOperations ManagementISBN:9781259667473Author:William J StevensonPublisher:McGraw-Hill Education
 Operations and Supply Chain Management (Mcgraw-hi...Operations ManagementISBN:9781259666100Author:F. Robert Jacobs, Richard B ChasePublisher:McGraw-Hill Education
 Purchasing and Supply Chain ManagementOperations ManagementISBN:9781285869681Author:Robert M. Monczka, Robert B. Handfield, Larry C. Giunipero, James L. PattersonPublisher:Cengage Learning
 Production and Operations Analysis, Seventh Editi...Operations ManagementISBN:9781478623069Author:Steven Nahmias, Tava Lennon OlsenPublisher:Waveland Press, Inc.

Practical Management Science
Operations Management
ISBN:9781337406659
Author:WINSTON, Wayne L.
Publisher:Cengage,

Operations Management
Operations Management
ISBN:9781259667473
Author:William J Stevenson
Publisher:McGraw-Hill Education

Operations and Supply Chain Management (Mcgraw-hi...
Operations Management
ISBN:9781259666100
Author:F. Robert Jacobs, Richard B Chase
Publisher:McGraw-Hill Education


Purchasing and Supply Chain Management
Operations Management
ISBN:9781285869681
Author:Robert M. Monczka, Robert B. Handfield, Larry C. Giunipero, James L. Patterson
Publisher:Cengage Learning

Production and Operations Analysis, Seventh Editi...
Operations Management
ISBN:9781478623069
Author:Steven Nahmias, Tava Lennon Olsen
Publisher:Waveland Press, Inc.