MATLAB: An Introduction with Applications
6th Edition
ISBN: 9781119256830
Author: Amos Gilat
Publisher: John Wiley & Sons Inc
expand_more
expand_more
format_list_bulleted
Question

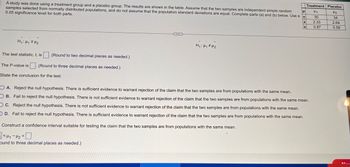
Transcribed Image Text:μ
A study was done using a treatment group and a placebo group. The results are shown in the table. Assume that the two samples are independent simple random
samples selected from normally distributed populations, and do not assume that the population standard deviations are equal. Complete parts (a) and (b) below. Use a
0.05 significance level for both parts.
n
H₁: H₁ H₂
(Round to two decimal places as needed.)
The P-value is (Round to three decimal places as needed.)
State the conclusion for the test.
The test statistic, t, is
CREED
H₁: H₁ H₂
X
Construct a confidence interval suitable for testing the claim that the two samples are from populations with the same mean.
<H1-H₂
ound to three decimal places as needed.)
Treatment Placebo
Hy
H₂
34
2.69
0.58
S
OA. Reject the null hypothesis. There is sufficient evidence to warrant rejection of the claim that the two samples are from populations with the same mean.
OB. Fail to reject the null hypothesis. There is not sufficient evidence to warrant rejection of the claim that the two samples are from populations with the same mean.
OC. Reject the null hypothesis. There is not sufficient evidence to warrant rejection of the claim that the two samples are from populations with the same mean.
OD. Fail to reject the null hypothesis. There is sufficient evidence to warrant rejection of the claim that the two samples are from populations with the same mean.
30
2.33
0.87
M...

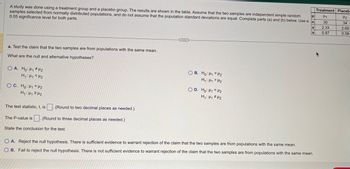
Transcribed Image Text:μ
A study was done using a treatment group and a placebo group. The results are shown in the table. Assume that the two samples are independent simple random
samples selected from normally distributed populations, and do not assume that the population standard deviations are equal. Complete parts (a) and (b) below. Use a n
0.05 significance level for both parts.
a. Test the claim that the two samples are from populations with the same mean.
What are the null and alternative hypotheses?
OA. Ho: H₁ H₂
H₁ H₁ H₂
OC. Ho: Hi<H2
H₁: H₁ H₂
The test statistic, t, is
(Round to two decimal places as needed.)
The P-value is (Round to three decimal places as needed.)
State the conclusion for the test.
***
OB. Ho: H1 H₂
H₁: HH₂
OD. Ho: H₁ H2
H₁: H₁ H₂
X
S
O A. Reject the null hypothesis. There is sufficient evidence to warrant rejection of the claim that the two samples are from populations with the same mean.
OB. Fail to reject the null hypothesis. There is not sufficient evidence to warrant rejection of the claim that the two samples are from populations with the same mean.
Treatment Placeb
H1
30
2.33
0.87
H₂
34
2.69
0.58
Expert Solution
This question has been solved!
Explore an expertly crafted, step-by-step solution for a thorough understanding of key concepts.
This is a popular solution
Trending nowThis is a popular solution!
Step by stepSolved in 4 steps with 1 images

Knowledge Booster
Similar questions
- Assume the samples are random and independent, the populations are nomally distributed, and the population variances are equal. The table available below shows the prices (in dollars) for a sample of automobile batteries. The prices are classified according to battery type. At a = 0.10, is there enough evidence conclude that at least one mean battery price is different from the others? Complete parts (a) through (e) below. E Click the icon to view the battery cost data. (a) Let u1. P2. H3 represent the mean prices for the group size 35, 65, and 24/24F respectively. Identify the claim and state Ho and H. H Cost of batteries by type The claim is the V hypothesis. Group size 35 Group size 65 Group size 24/24F 101 111 121 124 D 146 173 182 278 124 140 141 89 (b) Find the critical value, Fo, and identify the rejection region. 90 79 84 The rejection region is F Fo, where Fo = (Round to two decimal places as needed.) (c) Find the test statistic F. Print Done F= (Round to two decimal places as…arrow_forwardWhat are the values for SS and variance for the following sample of n = 3 scores? Sample: 8, 5, 2arrow_forwardA teacher would like to determine if quiz scores improve after completion of a worksheet. The students take a pre-quiz before the worksheet and then another quiz after the worksheet. (Pre-quiz score - Post-quiz score) Assume quiz scores are normally distributed. The grades for each quiz are given below. Use a significance level of a = 0.05. H₂: Hd = 0 Ha: Hd <0 pre-quiz 12 16 17 16 11 15 12 7 15 13 post-quiz 13 16 15 16 14 15 13 9 14 15 What is the test statistic? test statistic = (Report answer accurate to 2 decimal places.) What is the p-value for this sample? p-value= (Report answer accurate to 3 decimal places.) The correct decision is to Select an answer Conclusion: Select an answer that the worksheet improved quiz scores.arrow_forward
- Find the standardized test statistic estimate, z, to test the hypothesis that p, > p,. Use a= 0.01. The sample statistics listed below are from independent samples. Round to three decimal places. Sample statistics: n, = 100, x, = 38, and n2 = 140, X2 = 50 %3D %D O A. 0.638 B. 0.362 O C. 2.116 D. 1.324 S ting Click to select your answer. Type here to search hp 近arrow_forwardThe following is a sample of patient's calcium tests in mg/dL. 9.3 8.8 10.1 8.9 9.4 9.8 10.0 9.9 11.2 12.1 Find each of the following: The mean: The median: The third quartile: The standard deviation: The variance:arrow_forwardChoose the appropriate statistical test. When computing, be sure to round each answer as indicated. A dentist wonders if depression affects ratings of tooth pain. In the general population, using a scale of 1-10 with higher values indicating more pain, the average pain rating for patients with toothaches is 6.8. A sample of 30 patients that show high levels of depression have an average pain rating of 7.1 (variance 0.8). What should the dentist determine? 1. Calculate the estimated standard error. (round to 3 decimals). [st.error] 2. What is thet-obtained? (round to 3 decimals). 3. What is the t-cv? (exact value) 4. What is your conclusion? Only type "Reject" or Retain"arrow_forward
- Statistics students believe that the mean score on a first statistics test is 65. The instructor thinks that the mean score is higher. She samples 10 statistics students and obtains the scores: Grades 73.5 88 63.9 85.5 62.7 65 83.2 61.9 88 62.7 Test grades are believed to be normally distributed.Use a significance level of 5%. State the alternative hypothesis: HA:HA: μ>65μ>65 μ<65μ<65 μ≠65μ≠65 State the mean of the sample: State the standard error of the sample means: State the test statistic: t=t= State the p-value: Decision: Fail to reject the null hypothesis. Reject the null hypothesis.arrow_forwardWhat does the t test for the difference between the means of 2 independent populations assume? A. The sample sizes are equal. B. The sample variances are equal. C. The populations are approximately normal. D. All of the abovearrow_forwardListed below are systolic blood pressure measurements (mm Hg) taken from the right and left arms of the same woman. Assume that the paired sample data is a simple random sample and that the differences have a distribution that is approximately normal. Use a 0.05 significance level to test for a difference between the measurements from the two arms. What can be concluded? Right arm Left arm 151 136 120 134 134 181 174 180 156 138 In this example, Ha is the mean value of the differences d for the population of all pairs of data, where each individual difference d is defined as the measurement from the right arm minus the measurement from the left arm. What are the null and alternative hypotheses for the hypothesis test? O A. Ho: Hd = 0 O B. Ho: Hd 0 O C. Ho: Hd = 0 O D. Ho: Hd 0 H1: Ha>0arrow_forward
- Refer to the below table. Using an alpha = 0.05, test the claim that IQ scores are the same for children in three different blood lead level groups: low lead level, medium lead level, and high lead level). One-Way Analysis of Variance Summary Table for IQ Measurements for Children among Three Blood Lead Level Groups: Low Lead Level, Medium Lead Level, and High Lead Level. Source df SS MS F p Between-group (treatment) 2 469.1827 2677.864 2.30 0.104 Within-group (error) 118 203.6918 11745.05 Total 120arrow_forwardFind the standardized test statistic, z, to test the hypothesis that p, p,. Use a = 0.02. The sample statistics listed below are from independent samples. Round to three decimal places. Sample statistics: n, = 1000, x, = 250, and n, = 1200, X2 = 195 O A. 3.212 O B. 2.798 O C. 5.087 O D. 4.761 Click to select your answer. 02/16/21 ch 2.3 Homework (99+ 000000 eesitphotocarrow_forwardListed below are time intervals (min) between eruptions of a geyser. The "recent" times are within the past few years, and the "past" times are from 1995. Does it appear that the variation of the times between eruptions has changed? Use a 0.05 significance level. Assume that the two populations are normally distributed. E Click the icon to view the sample data. - X Sample data Identify the test statistic. The test statistic is (Round to two decimal places as needed.) Identify the P-value Recent 79 95 89 75 55 97 66 90 66 86 81 87 Past 92 85 94 99 68 82 89 98 84 98 92 91 The P-value is (Round to three decimal places as needed.) Print Done What is the conclusion for this hypothesis test? O A. Reject Ho. There is sufficient evidence to support the claim that the variation of the times between eruptions has changed. O B. Reject Ho. There is insufficient evidence to support the claim that the variation of the times between eruptions has changed. OC. Fail to reject Hg. There is sufficient…arrow_forward
arrow_back_ios
arrow_forward_ios
Recommended textbooks for you
 MATLAB: An Introduction with ApplicationsStatisticsISBN:9781119256830Author:Amos GilatPublisher:John Wiley & Sons Inc
 Probability and Statistics for Engineering and th...StatisticsISBN:9781305251809Author:Jay L. DevorePublisher:Cengage Learning
 Statistics for The Behavioral Sciences (MindTap C...StatisticsISBN:9781305504912Author:Frederick J Gravetter, Larry B. WallnauPublisher:Cengage Learning
 Elementary Statistics: Picturing the World (7th E...StatisticsISBN:9780134683416Author:Ron Larson, Betsy FarberPublisher:PEARSON
 The Basic Practice of StatisticsStatisticsISBN:9781319042578Author:David S. Moore, William I. Notz, Michael A. FlignerPublisher:W. H. Freeman
 Introduction to the Practice of StatisticsStatisticsISBN:9781319013387Author:David S. Moore, George P. McCabe, Bruce A. CraigPublisher:W. H. Freeman

MATLAB: An Introduction with Applications
Statistics
ISBN:9781119256830
Author:Amos Gilat
Publisher:John Wiley & Sons Inc

Probability and Statistics for Engineering and th...
Statistics
ISBN:9781305251809
Author:Jay L. Devore
Publisher:Cengage Learning

Statistics for The Behavioral Sciences (MindTap C...
Statistics
ISBN:9781305504912
Author:Frederick J Gravetter, Larry B. Wallnau
Publisher:Cengage Learning

Elementary Statistics: Picturing the World (7th E...
Statistics
ISBN:9780134683416
Author:Ron Larson, Betsy Farber
Publisher:PEARSON

The Basic Practice of Statistics
Statistics
ISBN:9781319042578
Author:David S. Moore, William I. Notz, Michael A. Fligner
Publisher:W. H. Freeman

Introduction to the Practice of Statistics
Statistics
ISBN:9781319013387
Author:David S. Moore, George P. McCabe, Bruce A. Craig
Publisher:W. H. Freeman