MATLAB: An Introduction with Applications
6th Edition
ISBN: 9781119256830
Author: Amos Gilat
Publisher: John Wiley & Sons Inc
expand_more
expand_more
format_list_bulleted
Question

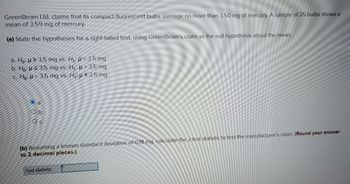
Transcribed Image Text:GreenBeam Ltd. claims that its compact fluorescent bulbs average no more than 3.50 mg of mercury. A sample of 25 bulbs shows a
mean of 3.59 mg of mercury.
(a) State the hypotheses for a right-tailed test, using GreenBeam's claim as the null hypothesis about the mean.
a. He: 23.5 mg vs. H₁: < 3.5 mg
b. Ho:
> 3.5 mg
3.5 mg vs. H₁:
-3.5 mg vs. H₁:
c. He:
# 3.5 mg
a
Ob
Oc
(b) Assuming a known standard deviation of 0.18 mg, calculate the z test statistic to test the manufacturer's claim. (Round your answer
to 2 decimal places.)
Test statistic

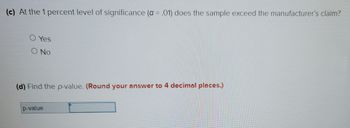
Transcribed Image Text:(c) At the 1 percent level of significance (a = .01) does the sample exceed the manufacturer's claim?
Yes
O No
(d) Find the p-value. (Round your answer to 4 decimal places.)
p-value
Expert Solution
This question has been solved!
Explore an expertly crafted, step-by-step solution for a thorough understanding of key concepts.
This is a popular solution
Trending nowThis is a popular solution!
Step by stepSolved in 3 steps with 2 images

Knowledge Booster
Similar questions
- A study was conducted to determine whether magnets were effective in treating pain. The values represent measurements of pain using the visual analog scale. Assume that both samples are independent simple random samples from populations having normal distributions. Use a 0.05 significance level to test the claim that those given a sham treatment have pain reductions that vary more than the pain reductions for those treated with magnets. What are the null and alternative hypotheses? OA. H₂:0²=0²2 H₁:0² > 0²/2 2 OC. Ho: 0² = 0² 0²2 2 H₁: 0²1 2 OB. Ho: 00₂ H₁:0² <0² OD. Ho: 0₁ 0₂ H₁: 0²₁ = 0²/2 n Sham 20 Magnet 20 X S 0.43 1.37 0.47 0.94arrow_forwardA, B, and carrow_forwardA researcher wants to check the claim that a certain species of reptile spend an average of 18.9 months in quaratine before being transported to another facility. She takes a random sample of 29 such cases from files and finds that I = 18 months and the sample standard deviation, s = 3 months. Test the claim at the 0.01 significance level.arrow_forward
- the researcher wishes to use numerical descriptive measures to summarize the data on each ofthe two variables: hours worked per week and yearly income.a) Prepare and display a numerical summary report for each of the two variables including summary measures such as mean, median, range, variance, standard deviation, smallest and largest values and the three quartiles.Notes: Use QUARTILE.EXC command to generate the three quartiles. b) Compute the correlation coefficient using the relevant Excel function to measure the direction and strength of the linear relationship between the two variables. Display and interpret the correlation value.arrow_forwardA suggestion is made that the proportion of people who have food allergies and/or sensitivities is 0.53. You believe that the proportion is actually less than 0.53. The hypotheses for this test are Null Hypothesis: p > 0.53, Alternative Hypothesis: p < 0.53. If you select a random sample of 27 people and 18 have a food allergy and/or sensitivity, what is your test statistic and p-value? 1) Test Statistic: 1.423, P-Value: 0.923 2) Test Statistic: -1.423, P-Value: 0.077 3) Test Statistic: -1.423, P-Value: 0.923 4) Test Statistic: 1.423, P-Value: 0.077 5) Test Statistic: 1.423, P-Value: 1.846arrow_forwardA researcher administers a treatment to a sample from a population with a mean of µ=60. If the treatment is expected to increase scores and a one-tailed test is used to evaluate the treatment effect, then the alternative hypothesis would state that u> 60. A. true B. falsearrow_forward
- 33arrow_forwardA traffic coordinator for a community wishes to determine whether or not there is any difference in the average age of female and male drivers involved in rear-end accidents. The hypothesis test is: Ho: 41 = 42 (no difference in mean age) 10 H1: (mean age is different) A random sample of males and females involved in rear-end accidents results in the following Minitab summary: N MEAN MEDIAN TRMEAN STDEV SE MEAN FEMALES 33 23.91 20.00 23.38 9.77 1.70 MALES 38 28.87 28.50 28.44 9.67 1.57 а). What is the value of the test statistic? Appropriate test: Test statistic = b). What is the decision rule at the 0.025 level of significance? с). What is the conclusion?arrow_forwardA researcher intends to estimate the effect of a drug on the scores of human subjects performing a task of psychomotor coordination. The members of a random sample of 9 subjects were given the drug prior to testing. The mean score in this group was 9.23, and the sample variance was 17.04. An independent random sample of 10 subjects was used as a control group and given a placebo prior to testing. The mean score in this control group was 15.93, and the sample variance was 27.44. Assuming that the population distributions are normal with equal variances, find a 90% confidence interval for the difference between the population mean scores. The confidence interval isarrow_forwardI got stuck on how to do the work for these, with null hypothesis.arrow_forwardRecords indicate that the mean weight of mature rainbow trout in Eagle Creek is 2.15 kg with a standard deviation of 0.48 kg. After years of marked oxygen depletion from pollutants in the creek, you want to perform a hypothesis test to see if the standard deviation, ơ, of weights has changed. To do so, you measure the weights of 15 randomly chosen mature rainbow trout from the creek and find that the sample standard deviation is 0.32 kg. Under the assumption that current weights of mature rainbow trout in the creek follow a normal distribution, you will perform a chi-square test. Find x, the value of the test statistic for your chi-square test. Round your answer to three or more decimal places.arrow_forwardScores on an IQ test are normally distributed. A sample of 25 IQ scores had standard deviation s= 8. Construct a 95% confidence interval for the population variance σ2 .arrow_forwardarrow_back_iosSEE MORE QUESTIONSarrow_forward_ios
Recommended textbooks for you
 MATLAB: An Introduction with ApplicationsStatisticsISBN:9781119256830Author:Amos GilatPublisher:John Wiley & Sons Inc
 Probability and Statistics for Engineering and th...StatisticsISBN:9781305251809Author:Jay L. DevorePublisher:Cengage Learning
 Statistics for The Behavioral Sciences (MindTap C...StatisticsISBN:9781305504912Author:Frederick J Gravetter, Larry B. WallnauPublisher:Cengage Learning
 Elementary Statistics: Picturing the World (7th E...StatisticsISBN:9780134683416Author:Ron Larson, Betsy FarberPublisher:PEARSON
 The Basic Practice of StatisticsStatisticsISBN:9781319042578Author:David S. Moore, William I. Notz, Michael A. FlignerPublisher:W. H. Freeman
 Introduction to the Practice of StatisticsStatisticsISBN:9781319013387Author:David S. Moore, George P. McCabe, Bruce A. CraigPublisher:W. H. Freeman

MATLAB: An Introduction with Applications
Statistics
ISBN:9781119256830
Author:Amos Gilat
Publisher:John Wiley & Sons Inc

Probability and Statistics for Engineering and th...
Statistics
ISBN:9781305251809
Author:Jay L. Devore
Publisher:Cengage Learning

Statistics for The Behavioral Sciences (MindTap C...
Statistics
ISBN:9781305504912
Author:Frederick J Gravetter, Larry B. Wallnau
Publisher:Cengage Learning

Elementary Statistics: Picturing the World (7th E...
Statistics
ISBN:9780134683416
Author:Ron Larson, Betsy Farber
Publisher:PEARSON

The Basic Practice of Statistics
Statistics
ISBN:9781319042578
Author:David S. Moore, William I. Notz, Michael A. Fligner
Publisher:W. H. Freeman

Introduction to the Practice of Statistics
Statistics
ISBN:9781319013387
Author:David S. Moore, George P. McCabe, Bruce A. Craig
Publisher:W. H. Freeman