FINANCIAL ACCOUNTING
10th Edition
ISBN: 9781259964947
Author: Libby
Publisher: MCG
expand_more
expand_more
format_list_bulleted
Question
thumb_up100%
Great Lakes is an internationally operating apparel manufacturer, specialized in the woven garment sector that offer expertise in the production of outerwear and bottoms, washing, dyeing, woven/knit hybrid garments, down and wellon filling and denim.
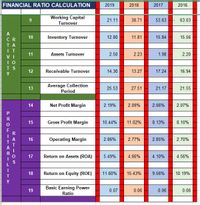
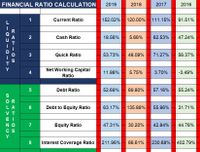
Attached the Financial ratios of Great lakes in 2016 to 2019.
Based on the Financial ratios attached, please analyse the Great Lakes Financial Report.

Transcribed Image Text:FINANCIAL RA TIO CALCULATION
2019
2018
2017
2016
Working Capital
Turnover
9
21.11
38.71
53.63
63.03
A
10
Inventory Turnover
12.80
11.81
15.84
15.56
CR
TA
I T
11
Assets Turnover
2.50
2.23
1.98
2.20
VI
TS
12
Receivable Turnover
14.30
13.27
17.24
16.94
Y
Average Collection
Period
13
25.53
27.51
21.17
21.55
14
Net Profit Margin
2.19%
2.09%
2.06%
2.07%
15
Gross Profit Margin
10.44%
11.02%
8.13%
8.10%
16
Operating Margin
2.86%
2.77%
2.85%
2.70%
17
Return on Assets (ROA)
5.49%
4.66%
4.10%
4.56%
18
Return on Equity (ROE)
11.60%
15.43%
9.56%
10.19%
Basic Earning Power
19
0.07
0.06
0.06
0.06
Ratio
RAT- OS
PROF -TABI L -TY

Transcribed Image Text:FINANCIAL RATIO CALCULATION
2019
2018
2017
2016
1
Current Ratio
152.02%
120.00%
111.15%
91.51%
L
Cash Ratio
18.56%
5.66%
62.53%
47.24%
3
Quick Ratio
53.73%
48.09%
71.27%
56.37%
Net Working Capital
4
11.86%
5.75%
3.70%
-3.49%
Ratio
5
Debt Ratio
52.69%
69.80%
57.16%
55.24%
S
OR
LA
6
Debt to Equity Ratio
63.17%
135.89%
55.96%
31.71%
VT
E I
NO
7
Equity Ratio
47.31%
30.20%
42.84%
44.76%
Cs
Y
Interest Coverage Ratio
211.96%
66.61%
230.68%
402.79%
RAT- O 0
Expert Solution
This question has been solved!
Explore an expertly crafted, step-by-step solution for a thorough understanding of key concepts.
Step by stepSolved in 3 steps

Knowledge Booster
Learn more about
Need a deep-dive on the concept behind this application? Look no further. Learn more about this topic, accounting and related others by exploring similar questions and additional content below.Similar questions
- Please help. Thanksarrow_forwardUnder Armour, Incorporated is an American supplier of sportswear and casual apparel. Following are selected financial data for the company for the period 2009 to 2013. Profit margin (%) Retention ratio (%) Asset turnover (X) Financial leverage (X) Growth rate in sales (%) 2009 5.2 100.0 1.6 1.7 18.3 2010 6.1 100.0 1.6 1.7 24.4 2011 6.3 100.0 1.6 1.9 38.6 2012 6.7 100.0 1.6 1.8 24.8 2013 6.7 100.0 1.5 1.9 27.3 a. Calculate Under Armour's annual sustainable growth rate for the years 2009 through 2013. Note: Round your answers to 1 decimal place.arrow_forwardGranite, Incorporated is the largest uniform supplier in North America. Selected information from its annual report follows. For the 2019 fiscal year, the company reported sales revenue of $6.1 billion and Cost of Goods Sold of $4.3 billion. Fiscal Year Balance Sheet (amounts in millions) Cash and Cash Equivalents Accounts Receivable, Net Inventory Prepaid Rent and Other Current Assets Accounts Payable Salaries and Wages Payable Notes Payable (short-term) Other Current Liabilities 2019 Current Ratio Inventory Turnover Ratio Accounts Receivable Turnover Ratio $ 540 860 330 795 210 520 116 28 2018 $430 810 340 660 190 520 28 320 Required: Assuming that all sales are on credit, compute the following ratios for 2019. Note: Do not round intermediate calculations. Round your final answers to 2 decimal places.arrow_forward
- You are an investment analyst at FI Investments tasked to value FBC firm a Southern Agricultural Conglomerate. The following financial information was recently released for FBC. The company’s 2018 and 2017 annual financial reports are contained in tables 1 and 2 below, along with important additional information: Table 1: FBC statement of financial position (R millions) 2018 2017 Cash and equivalents R149 R83 Accounts receivable 295 265 Inventory 275 285 Total current assets R719 R633 Total fixed assets 3 909 3 856 Accounts payable 228 220 Notes payable 0 0 Total current liabilities 228 220 Long term debt 1 800 1 650 Total liabilities and shareholders equity 3 909 3 856 Number of shares outstanding (millions) 100 100 Additional information: Depreciation (2018): R483. The firm spent R250m in profitable projects during the…arrow_forwardInferring Transactions from Financial StatementsCostco Wholesale Corporation operates membership warehouses selling food, appliances, consumer electronics, apparel and other household goods at 721locations across the U.S. as well as in Canada, the United Kingdom, Japan, Australia, South Korea, Taiwan, Mexico and Puerto Rico. As of its fiscal year-end 2016, Costco had approximately 86.7 million members. Selected fiscal-year information from the company's balance sheets follows. Selected Balance Sheet Data ($ millions) 2016 2015 Merchandise inventories $8,969 $8,908 Deferred membership income (liability) 1,362 1,269 (a) During fiscal 2016, Costco collected $2,739 million cash for membership fees. Use the financial statement effects template to record the cash collected for membership fees.(b) Costco recorded merchandise costs (that is, cost of goods sold) of $102,901 million in 2016. Record this transaction in the financial statement effects template.(c) Determine the…arrow_forwardNobility Homes, Incorporated, is a small maker of manufactured homes sold throughout the state of Florida. The following are selected financial data for the company for the period 2012-2016. Year 2012 2013 2014 2015 2016 2012 % 2013 0.4 100.0 0.44 1.09 17.4 Profit margin (8) Retention ratio (8) Asset turnover (X) Financial leverage (X) Growth rate in sales (t) Source: Data from Nobility Homes 2012 to 2016 annual reports a. Calculate Nobility Homes' annual sustainable growth rate for the years 2012 through 2016. Note: Round your answers to 1 decimal place. Sustainable Growth Rate % % % 6.7 % 2014 5.0 100.0 0.49 1.13 16.9 2015 5.4 100.0 0.54 1.16 14.4 9.4 100.0 0.59 2016 1.21 30.9 17.4 100.0 0.64 1.29 22.4arrow_forward
- You are required to calculate:1. Liquidity ratios 2. Solvency rations 3. Profitability ratios For the selected companies and shortly write your comments and findings.arrow_forwardAnswer the questions based on P/E ratios per company given. Industry: Apparel Industry average P/E: AMC Entertainment Holdings, Inc. (NYSE:AMC) P/E: -4.1 Big Screen Entertainment Group, Inc. (OTCPK:BSEG) P/E: 19.92 Valiant Eagle Inc. (OTCPK:PSRU) OTCPK:PSRU P/E: 0.02 Cinemark Holdings, Inc. (NYSE:CNK) P/E: 21.41 Electronic Arts Inc. (NasdaqGS:EA) P/E: 57.12 The Movie Studio, Inc. (OTCPK:MVES) P/E: N/A at a loss The Walt Disney Company (NYSE:DIS) P/E: 88.15 Live Nation Entertainment, Inc. (NYSE:LYV) P/E: -14.42 Lions Gate Entertainment Corp. (NYSE:LGF.A) P/E: 37.34 Madison Square Garden Entertainment Corp. (NYSE:MSGE) P/E: -4.928 Which firms are investors most excited about, and which firms are investors least excited about? Are there any significant outliers present? Note the highest and lowest P/E ratios. Do these numbers surprise you? Do the P/E ratios make sense; do you see any that seem out of linearrow_forward
arrow_back_ios
arrow_forward_ios
Recommended textbooks for you

 AccountingAccountingISBN:9781337272094Author:WARREN, Carl S., Reeve, James M., Duchac, Jonathan E.Publisher:Cengage Learning,
 Accounting Information SystemsAccountingISBN:9781337619202Author:Hall, James A.Publisher:Cengage Learning,
 Horngren's Cost Accounting: A Managerial Emphasis...AccountingISBN:9780134475585Author:Srikant M. Datar, Madhav V. RajanPublisher:PEARSON
 Intermediate AccountingAccountingISBN:9781259722660Author:J. David Spiceland, Mark W. Nelson, Wayne M ThomasPublisher:McGraw-Hill Education
 Financial and Managerial AccountingAccountingISBN:9781259726705Author:John J Wild, Ken W. Shaw, Barbara Chiappetta Fundamental Accounting PrinciplesPublisher:McGraw-Hill Education


Accounting
Accounting
ISBN:9781337272094
Author:WARREN, Carl S., Reeve, James M., Duchac, Jonathan E.
Publisher:Cengage Learning,

Accounting Information Systems
Accounting
ISBN:9781337619202
Author:Hall, James A.
Publisher:Cengage Learning,

Horngren's Cost Accounting: A Managerial Emphasis...
Accounting
ISBN:9780134475585
Author:Srikant M. Datar, Madhav V. Rajan
Publisher:PEARSON

Intermediate Accounting
Accounting
ISBN:9781259722660
Author:J. David Spiceland, Mark W. Nelson, Wayne M Thomas
Publisher:McGraw-Hill Education

Financial and Managerial Accounting
Accounting
ISBN:9781259726705
Author:John J Wild, Ken W. Shaw, Barbara Chiappetta Fundamental Accounting Principles
Publisher:McGraw-Hill Education