
MATLAB: An Introduction with Applications
6th Edition
ISBN: 9781119256830
Author: Amos Gilat
Publisher: John Wiley & Sons Inc
expand_more
expand_more
format_list_bulleted
Related questions
Concept explainers
Question
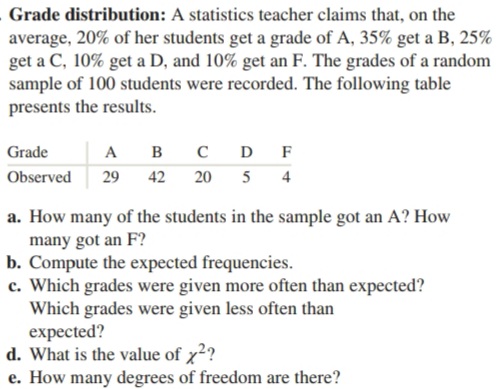

Transcribed Image Text:- Grade distribution: A statistics teacher claims that, on the
average, 20% of her students get a grade of A, 35% get a B, 25%
get a C, 10% get a D, and 10% get an F. The grades of a random
sample of 100 students were recorded. The following table
presents the results.
в сD F
5 4
Grade
A
Observed
29
42
20
a. How many of the students in the sample got an A? How
many got an F?
b. Compute the expected frequencies.
c. Which grades were given more often than expected?
Which grades were given less often than
expected?
d. What is the value of x2?
e. How many degrees of freedom are there?

Transcribed Image Text:Is the lottery fair? Mega Millions is a multistate lottery in
which players try to guess the numbers that will turn up in a
drawing of numbered balls. One of the balls drawn is the Mega
Ball. Matching the number drawn on the Mega Ball increases
ones winnings. During a recent three-year period, the Mega Ball
was drawn from a collection of 15 balls numbered 1 through 15,
and a total of 344 drawings were made. For the purposes of this
exercise, we grouped the numbers into five categories: 1-3, 4–6,
and so on. If the lottery is fair, then the winning number is
equally likely to occur in any category. Following are the
observed frequencies.
Category
1-3
4-6
7-9
10-12
13–15
Observed
73
64
74
62
71
Source: www.usamega.com
a. Compute the expected frequencies.
b. Compute the value of x?
c. How many degrees of freedom are there?
d. Test the hypothesis that each of the categories is
Expert Solution
This question has been solved!
Explore an expertly crafted, step-by-step solution for a thorough understanding of key concepts.

This is a popular solution

Trending nowThis is a popular solution!

Step by stepSolved in 4 steps

Knowledge Booster


Learn more about
Need a deep-dive on the concept behind this application? Look no further. Learn more about this topic, statistics and related others by exploring similar questions and additional content below.Similar questions
- A new statistics book has been written and a faculty member and a student are asked to rank the new book and the other five best statistics books. How much do the student and professor agree on their assessment of the books (1 being the favorite, 6 being the least)? Use the data below to answer the following question:arrow_forwardThe correlation between midterm and final grades for 300 students is 0.620. If 5 points are added to each midterm grade, the new r will be: a. 0.124 b. 0.57 c. 0.62 d. 0.744arrow_forwardShort Answer 3: Thirty students were surveyed as to their ethnicity, and the following was the data: Hisp. White Asian Hisp. Afr. White Afr. Hisp. Asian Hisp. Hisp. White White White Hisp. White Afr. Hisp. Hisp. Hisp. Hisp. White Hisp. White Afr. White Afr. Hisp. White Hisp. Graph a bar chart and a pie chart BY HAND, and upload them to this question using the "File Upload" feature!arrow_forward
- The table shows the number of students on the track team who run the hurdles and in relays. No student runs in both. Hurdles Relays 7th graders 8 12 8th graders 15 15 Total 23 27 Total 20 30 50 What is the joint relative frequency to the nearest hundredth of boys who run relays?arrow_forwardIn a scatter diagram of the data of 50 participants, how many points are plotted? A. 5 B. 25 C. 50 D. 100arrow_forward4. Find each value requested for the distribution of scores in the following table. а. п b. ΣΧ C. Σχ f 1 4 2 3 3 2 5 1 3 UNGarrow_forward
- R A veterinarian recorded how many kittens were born in each litter. This data is summarized in the L histogram below. (Note: The last class actually represents "7 or more kittens," not just 7 kittens.) 14 12 10- 8- 6- 4 1 2 3 4 7 8 # of kittens What is the frequency of litters having at most 3 kittens? ans = Fe Ro 1 FEB 18 P. W MacBook Air 20 000 esc F5 F6 F2 F3 F4 F1 & ! @ 1 2 4 5 Q W R %24 # 3 6 2. Frequencyarrow_forwardConsider the following Venn diagram that summarizes the data from 50 people. How many people own just one pet? Birds 10 10 1. 2. 2. Cats Dogs 32 22 25 20 cerarrow_forwardHere are several z-scores. Which person scored furthest from average? Ahab: Z = +1.2 Brianna: Z = -0.8 Cecilia: Z = -1.4 Darnell: Z = +0.7 Evelyn: Z = +0.2 Group of answer choices Brianna Cecilia Cannot tell from the information given Evelyn Darnell Ahabarrow_forward
- 1. Find the value of Q₁ for this data: 2, 4, 6, 8, 10, 12, 14 O A 4 B.5 O c.8 OD. 12arrow_forwardA group of students were surveyed about the number of siblings they have. Their responses are summarized in the frequency table below. How many students responded to the survey? Number of Siblings Frequency 0 6 1 8 2 5 3 3 4 1 5 or more 3arrow_forward
arrow_back_ios
arrow_forward_ios
Recommended textbooks for you
- MATLAB: An Introduction with ApplicationsStatisticsISBN:9781119256830Author:Amos GilatPublisher:John Wiley & Sons Inc
 Probability and Statistics for Engineering and th...StatisticsISBN:9781305251809Author:Jay L. DevorePublisher:Cengage Learning
 Statistics for The Behavioral Sciences (MindTap C...StatisticsISBN:9781305504912Author:Frederick J Gravetter, Larry B. WallnauPublisher:Cengage Learning
  Elementary Statistics: Picturing the World (7th E...StatisticsISBN:9780134683416Author:Ron Larson, Betsy FarberPublisher:PEARSON
 The Basic Practice of StatisticsStatisticsISBN:9781319042578Author:David S. Moore, William I. Notz, Michael A. FlignerPublisher:W. H. Freeman
 Introduction to the Practice of StatisticsStatisticsISBN:9781319013387Author:David S. Moore, George P. McCabe, Bruce A. CraigPublisher:W. H. Freeman
MATLAB: An Introduction with Applications
Statistics
ISBN:9781119256830
Author:Amos Gilat
Publisher:John Wiley & Sons Inc
Probability and Statistics for Engineering and th...
Statistics
ISBN:9781305251809
Author:Jay L. Devore
Publisher:Cengage Learning
Statistics for The Behavioral Sciences (MindTap C...
Statistics
ISBN:9781305504912
Author:Frederick J Gravetter, Larry B. Wallnau
Publisher:Cengage Learning
Elementary Statistics: Picturing the World (7th E...
Statistics
ISBN:9780134683416
Author:Ron Larson, Betsy Farber
Publisher:PEARSON
The Basic Practice of Statistics
Statistics
ISBN:9781319042578
Author:David S. Moore, William I. Notz, Michael A. Fligner
Publisher:W. H. Freeman
Introduction to the Practice of Statistics
Statistics
ISBN:9781319013387
Author:David S. Moore, George P. McCabe, Bruce A. Craig
Publisher:W. H. Freeman