ENGR.ECONOMIC ANALYSIS
14th Edition
ISBN: 9780190931919
Author: NEWNAN
Publisher: Oxford University Press
expand_more
expand_more
format_list_bulleted
Question
Multiple answers may be correct.

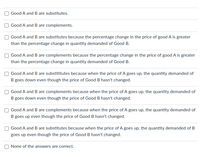
Transcribed Image Text:**Understanding Relationships Between Goods: Substitutes and Complements**
When analyzing the relationships between two goods, it is essential to determine whether they are substitutes or complements. The following scenarios illustrate different circumstances in which goods A and B can be considered substitutes or complements based on changes in prices and quantities demanded.
1. **Good A and B are substitutes.**
2. **Good A and B are complements.**
3. **Good A and B are substitutes because the percentage change in the price of good A is greater than the percentage change in quantity demanded of Good B.**
4. **Good A and B are complements because the percentage change in the price of good A is greater than the percentage change in quantity demanded of Good B.**
5. **Good A and B are substitutes because when the price of A goes up, the quantity demanded of B goes down even though the price of Good B hasn't changed.**
6. **Good A and B are complements because when the price of A goes up, the quantity demanded of B goes down even though the price of Good B hasn't changed.**
7. **Good A and B are complements because when the price of A goes up, the quantity demanded of B goes up even though the price of Good B hasn't changed.**
8. **Good A and B are substitutes because when the price of A goes up, the quantity demanded of B goes up even though the price of Good B hasn't changed.**
9. **None of the answers are correct.**
In conclusion, understanding whether goods are substitutes or complements involves analyzing how changes in the price of one good affect the quantity demanded of another good. These scenarios offer a variety of perspectives to determine the nature of this relationship.

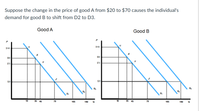
Transcribed Image Text:### Educational Explanation of Demand Shift
#### Concept: Impact of Price Change on Demand
In economics, the demand for one good can be influenced by the price of another good. Graphs illustrating this principle help in visualizing how changes in one market can impact another.
#### Scenario Presented
Suppose the change in the price of good A from $20 to $70 causes the individual's demand for good B to shift from D2 to D3.
#### Graph Analysis
This scenario is depicted in two graphs, one showing the demand curves for good A and the other for good B. Each graph has the following components:
1. **Axes**:
- **Horizontal Axis (Q)**: Represents the quantity of goods.
- **Vertical Axis (P)**: Represents the price of goods.
2. **Demand Curves**:
- The demand curves are marked as D1, D2, and D3 in both graphs, representing different levels of demand.
- D1 represents the initial demand, D2 is the intermediate demand, and D3 is the final demand after the price change.
#### Graph Details
##### Good A
- Initial Situation:
- **Price Levels**: Points W, X, Y, and Z mark specific price levels ($140, $90, $70, and $20 respectively).
- At $20, the quantity demanded is around 70 units (point Z on D1).
- Post Price Increase:
- The price increases to $70, reducing the quantity demanded to about 45 units (point Y on D2).
##### Good B
- Initial Situation:
- Similar price points: W, X, Y, and Z.
- At $20, quantity demanded is around 70 units (point Z on D1).
- Post Price Increase:
- The price effect from Good A causes a shift in the demand curve.
- Initially, at $70, the quantity demanded is around 35 units (point X on D2).
- After the price increase in Good A, the demand curve shifts left to D3, where at $70, the new quantity demanded is around 10 units.
#### Interpretation
The leftward shift in demand for good B from D2 to D3 indicates a decrease in quantity demanded for good B at each price level. This shift is attributed to the increase in the price of good A, showcasing how the two goods are related in terms of
Expert Solution
This question has been solved!
Explore an expertly crafted, step-by-step solution for a thorough understanding of key concepts.
This is a popular solution
Trending nowThis is a popular solution!
Step by stepSolved in 2 steps

Knowledge Booster
Learn more about
Need a deep-dive on the concept behind this application? Look no further. Learn more about this topic, economics and related others by exploring similar questions and additional content below.Similar questions
- Your company has a customer list that includes 3000 people. Your market research indicates that 90 of them responded to the coupon. If you send a coupon to ONE customer at random, what’s the probability that he or she will use the coupon? Group of answer choices 3%. 9%. 30%. 90%. None of the above.arrow_forwardA risk-neutral worker can choose Low or High effort. The manager cannot observe the worker's action, but the manager can observe the realized revenue for the firm (either $300 or $500). Low Effort Cost for worker= $0 Probability Low Revenue ($300)=80% Probability High Revenue ($500)=20% High Effort Cost for worker= $40 Probability Low Revenue ($300)=40% Probability High Revenue ($500)=60% Instead of offering a flat wage, the manager is trying a new payment scheme. The manager is currently offering to the worker a payment equal to 40% of the revenue of the firm. Given this payment, the firm's expected profit will bearrow_forwardHow might the confirmation tendency affect Nathan's decision and what could he do to mitigate the possible effects of this tendency in order to improve his professional judgment?arrow_forward
- Moral hazard is consistent with the idea that when people have health insurance that protects against high medical expenses, they tend to get sick more often. seek less medical care. get sick less often. seek more medical care.arrow_forwardSoft selling occurs when a buyer is skeptical of the usefulness of a product and the seller offers to set a price that depends on realized value. For example, suppose a sales representative is trying to sell a company a new accounting system that will, with certainty, reduce costs by 10%. However, the customer has heard this claim before and believes there is only a 30% chance of actually realizing that cost reduction and a 70% chance of realizing no cost reduction. Assume the customer has an initial total cost of $300. According to the customer's beliefs, the expected value of the accounting system, or the expected reduction in cost, is . Suppose the sales representative initially offers the accounting system to the customer for a price of $19.50. The information asymmetry stems from the fact that the has more information about the efficacy of the accounting system than does the . At this price, the customer purchase the accounting system, since the expected…arrow_forwardSoft selling occurs when a buyer is skeptical of the usefulness of a product and the seller offers to set a price that depends on realized value. For example, suppose a sales representative is trying to sell a company a new accounting system that will, with certainty, reduce costs by 10%. However, the customer has heard this claim before and believes there is only a 20% chance of actually realizing that cost reduction and a 80% chance of realizing no cost reduction. Assume the customer has an initial total cost of $200. According to the customer's beliefs, the expected value of the accounting system, or the expected reduction in cost, is $____ . Suppose the sales representative initially offers the accounting system to the customer for a price of $12.00. The information asymmetry stems from the fact that the ______(sales rep or buyer) has less information about the efficacy of the accounting system than does the ______(sales rep or buyer) . At this price, the…arrow_forward
arrow_back_ios
arrow_forward_ios
Recommended textbooks for you

 Principles of Economics (12th Edition)EconomicsISBN:9780134078779Author:Karl E. Case, Ray C. Fair, Sharon E. OsterPublisher:PEARSON
 Engineering Economy (17th Edition)EconomicsISBN:9780134870069Author:William G. Sullivan, Elin M. Wicks, C. Patrick KoellingPublisher:PEARSON
 Principles of Economics (MindTap Course List)EconomicsISBN:9781305585126Author:N. Gregory MankiwPublisher:Cengage Learning
 Managerial Economics: A Problem Solving ApproachEconomicsISBN:9781337106665Author:Luke M. Froeb, Brian T. McCann, Michael R. Ward, Mike ShorPublisher:Cengage Learning
 Managerial Economics & Business Strategy (Mcgraw-...EconomicsISBN:9781259290619Author:Michael Baye, Jeff PrincePublisher:McGraw-Hill Education


Principles of Economics (12th Edition)
Economics
ISBN:9780134078779
Author:Karl E. Case, Ray C. Fair, Sharon E. Oster
Publisher:PEARSON

Engineering Economy (17th Edition)
Economics
ISBN:9780134870069
Author:William G. Sullivan, Elin M. Wicks, C. Patrick Koelling
Publisher:PEARSON

Principles of Economics (MindTap Course List)
Economics
ISBN:9781305585126
Author:N. Gregory Mankiw
Publisher:Cengage Learning

Managerial Economics: A Problem Solving Approach
Economics
ISBN:9781337106665
Author:Luke M. Froeb, Brian T. McCann, Michael R. Ward, Mike Shor
Publisher:Cengage Learning

Managerial Economics & Business Strategy (Mcgraw-...
Economics
ISBN:9781259290619
Author:Michael Baye, Jeff Prince
Publisher:McGraw-Hill Education