MATLAB: An Introduction with Applications
6th Edition
ISBN: 9781119256830
Author: Amos Gilat
Publisher: John Wiley & Sons Inc
expand_more
expand_more
format_list_bulleted
Concept explainers
Question

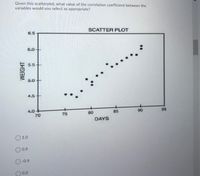
Transcribed Image Text:Given this scatterplot, what value of the correlation coefficient between the
variables would you select as appropriate?
6.5
SCATTER PLOT
6.0
55
5.0
4.5
4.0
70
75
80
85
90
95
DAYS
O 1.0
O0.9
-0.9
Q0.0
WEIGHT
Expert Solution
arrow_forward
Step 1
From given scatter plot :
we observe that ;
There is a strong positive correlation between two variables(weight and days ).
Trending nowThis is a popular solution!
Step by stepSolved in 2 steps

Knowledge Booster
Learn more about
Need a deep-dive on the concept behind this application? Look no further. Learn more about this topic, statistics and related others by exploring similar questions and additional content below.Similar questions
- Which of the following best describes the Pearson correlation for these data? X Y 2 5 5 1 3 4 4 2arrow_forwardMatch each scatterplot shown below with one of the four specified correlation coefficients. 8 89% 0 go eagle 880 09 O a. b. 0.42 c. 0.88 -0.44 -0.85 d.arrow_forwardAssume that you have paired values consisting of heights (in inches) and weights (in lb) from 40 randomly selected men. The linear correlation coefficient r is 0.567. Find the value of the coefficient of determination. What practical information does the coefficient of determination provide? Question content area bottom Part 1 Choose the correct answer below. A. The coefficient of determination is 0.321. 32.1% of the variation is explained by the linear correlation, and 67.9% is explained by other factors. B. The coefficient of determination is 0.679. 67.9% of the variation is explained by the linear correlation, and 32.1% is explained by other factors. C. The coefficient of determination is 0.321. 67.9% of the variation is explained by the linear correlation, and 32.1% is explained by other factors. D. The coefficient of determination is 0.679. 32.1% of the variation is explained by the linear correlation, and 67.9% is…arrow_forward
- Which of the following correlation coefficients indicate the strongest relationship between two variables? A .20 B .87 C .80 D -.95arrow_forwardGiven the table below, use your calculator to find the Correlation Coefficient xx 7.1 9.6 8.9 4.5 2.9 4.4 yy 17.9 25 22.4 18.6 12.3 15.9arrow_forwardUse the data values in the table below to calculate the correlation between the variables x and y. Submit the link through Canvas to either a photo of your work on paper or a link to a google sheet. y 4 27.22 5 23.83 6 23.94 7 22.85 8 20.96 9 17.07 10 14.68 11 16.49 12 14.6 Give your answer to three decimal places.arrow_forward
- Please help!arrow_forwardUse the data values in the table below to calculate the correlation between the variables x and y.Submit the link through Canvas to either a photo of your work on paper or a link to a google sheet. x y 5 15.3 6 20.06 7 21.42 8 24.18 9 28.64 10 31.5 11 31.86 Give your answer to three decimal places.arrow_forwardAnswerarrow_forward
arrow_back_ios
arrow_forward_ios
Recommended textbooks for you
 MATLAB: An Introduction with ApplicationsStatisticsISBN:9781119256830Author:Amos GilatPublisher:John Wiley & Sons Inc
 Probability and Statistics for Engineering and th...StatisticsISBN:9781305251809Author:Jay L. DevorePublisher:Cengage Learning
 Statistics for The Behavioral Sciences (MindTap C...StatisticsISBN:9781305504912Author:Frederick J Gravetter, Larry B. WallnauPublisher:Cengage Learning
 Elementary Statistics: Picturing the World (7th E...StatisticsISBN:9780134683416Author:Ron Larson, Betsy FarberPublisher:PEARSON
 The Basic Practice of StatisticsStatisticsISBN:9781319042578Author:David S. Moore, William I. Notz, Michael A. FlignerPublisher:W. H. Freeman
 Introduction to the Practice of StatisticsStatisticsISBN:9781319013387Author:David S. Moore, George P. McCabe, Bruce A. CraigPublisher:W. H. Freeman

MATLAB: An Introduction with Applications
Statistics
ISBN:9781119256830
Author:Amos Gilat
Publisher:John Wiley & Sons Inc

Probability and Statistics for Engineering and th...
Statistics
ISBN:9781305251809
Author:Jay L. Devore
Publisher:Cengage Learning

Statistics for The Behavioral Sciences (MindTap C...
Statistics
ISBN:9781305504912
Author:Frederick J Gravetter, Larry B. Wallnau
Publisher:Cengage Learning

Elementary Statistics: Picturing the World (7th E...
Statistics
ISBN:9780134683416
Author:Ron Larson, Betsy Farber
Publisher:PEARSON

The Basic Practice of Statistics
Statistics
ISBN:9781319042578
Author:David S. Moore, William I. Notz, Michael A. Fligner
Publisher:W. H. Freeman

Introduction to the Practice of Statistics
Statistics
ISBN:9781319013387
Author:David S. Moore, George P. McCabe, Bruce A. Craig
Publisher:W. H. Freeman