MATLAB: An Introduction with Applications
6th Edition
ISBN: 9781119256830
Author: Amos Gilat
Publisher: John Wiley & Sons Inc
expand_more
expand_more
format_list_bulleted
Question

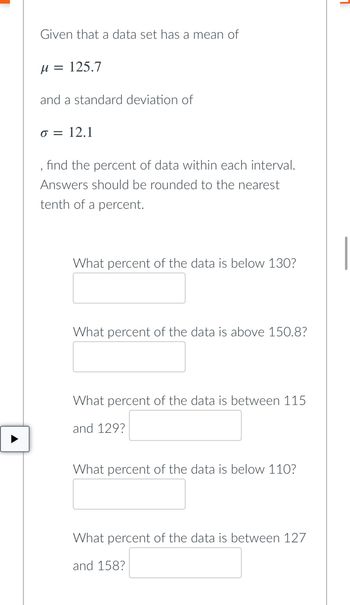
Transcribed Image Text:Given that a data set has a mean of
µ = 125.7
and a standard deviation of
o = 12.1
find the percent of data within each interval.
Answers should be rounded to the nearest
tenth of a percent.
What percent of the data is below 130?
What percent of the data is above 150.8?
What percent of the data is between 115
and 129?
What percent of the data is below 110?
What percent of the data is between 127
and 158?
Expert Solution
This question has been solved!
Explore an expertly crafted, step-by-step solution for a thorough understanding of key concepts.
This is a popular solution
Trending nowThis is a popular solution!
Step by stepSolved in 3 steps with 5 images

Knowledge Booster
Similar questions
- On a nationwide math test, the mean was 58 and the standard deviation was 4. If Roberto scored 70, what was his z-score? Use the formula Z where is the mean, o is σ the standard deviation, and x is Roberto's score. Round to 4 decimal places. X н =arrow_forwardHelp me pleasearrow_forwardthe mean (and standard deviation) snowfalss for two cities are noted below. Ottawa : Mean=98 inches per year, s=25 inches Bostone: mean= 44 inches per year, s=17 inches In 2018, ottawa recieve 119 inches of snowfall, while boston recored 62 inches. What city had a worse winter in 2018 relative to its average?arrow_forward
- Run the descriptive statistics for hrs/week of exercise. Include the mean, median, quartiles, min, max, standard deviation and IQR. First do this for hrs/week of exercise overall. Copy and paste the values below. Then redo this splitting up the data by sex. Copy and paste that below too. What similarities and/or differences do you see? Age Gender Height Arm Length Number Siblings Birth Order Handedness Number Classes Number Credits Hrs. Exercise Athlete at Broome Hrs. TV Award Pulse Number Piercings Facebook Friends Followers on Instagram Tattoo Division Local section 18 f 63 27.5 2 3 r 4 14 1.5 n 3 NP 74 2 82 72 n HS y 4 19 m 74 31.5 4 5 r 4 11 5 n 1.5 O 0 600 700 n STEM y 4 17 f 66 29.2 2 2 l 6 15 5 y 21 NP 64 2 1801 1370 n HS y 4 18 f 66 30 5 5 r 4 12 30 n 15 NP 91 1…arrow_forwardDraw by hand or in Excel fully labelled curves on a common scale to represent two sets of scores where: b. Mean = 50, Standard Deviation = 2, Mean = 50, Standard Deviation = 5. CUAarrow_forwardfor the data shown, answer the questions, round to 2 decimal places, 10.9,12.5,29.8,19.3,19.7,23.3,2.8,29.2,23.5. find the mean, median and the standard deviation.arrow_forward
- Assume that the readings on the thermometers are normally distributed with a mean of 0° and standard deviation of 1.00°C. A thermometer is randomly selected and tested. Draw a sketch and find the temperature reading corresponding to Pa1, the 91st percentile. This is the temperature reading separating the bottom 91% from the top 9%. Click to view page 1 of the table Click to view page 2 of the table. Which graph represents Pa,? Choose the correct graph below. OD. Oc. OB. OA. Ay The temperature for P91 is approximately . (Round to two decimal places as needed.) XLSX Click to select vour answerls). 33283.xls Exit Honorlock 22 MacBook Air 吕0 000 000 F4 F3 F6 F7 F8 F9 FIC #3 2$ * 3 4 5 6 7 8 E R Y Uarrow_forwardPlease awnser following question 2. An overbearing mother recorded the number of minutes her daughter spentexercising over 4 days. Here are the number of minutes per day:2, 9, 14, 15a. Write out the formula for: mean of xb. Use the formula to evaluate mean of x, by plugging in the values and manually carrying outthe calculation.c. Write out the formula for standard deviation. Please solve a, b and carrow_forwardIn a certain population, the mean score on a test is 420. The standard deviation is 105. If the distribution or scores is normal, which of these scores should occur most often. a. 385 b314 c. 540 d. 526arrow_forward
arrow_back_ios
arrow_forward_ios
Recommended textbooks for you
 MATLAB: An Introduction with ApplicationsStatisticsISBN:9781119256830Author:Amos GilatPublisher:John Wiley & Sons Inc
 Probability and Statistics for Engineering and th...StatisticsISBN:9781305251809Author:Jay L. DevorePublisher:Cengage Learning
 Statistics for The Behavioral Sciences (MindTap C...StatisticsISBN:9781305504912Author:Frederick J Gravetter, Larry B. WallnauPublisher:Cengage Learning
 Elementary Statistics: Picturing the World (7th E...StatisticsISBN:9780134683416Author:Ron Larson, Betsy FarberPublisher:PEARSON
 The Basic Practice of StatisticsStatisticsISBN:9781319042578Author:David S. Moore, William I. Notz, Michael A. FlignerPublisher:W. H. Freeman
 Introduction to the Practice of StatisticsStatisticsISBN:9781319013387Author:David S. Moore, George P. McCabe, Bruce A. CraigPublisher:W. H. Freeman

MATLAB: An Introduction with Applications
Statistics
ISBN:9781119256830
Author:Amos Gilat
Publisher:John Wiley & Sons Inc

Probability and Statistics for Engineering and th...
Statistics
ISBN:9781305251809
Author:Jay L. Devore
Publisher:Cengage Learning

Statistics for The Behavioral Sciences (MindTap C...
Statistics
ISBN:9781305504912
Author:Frederick J Gravetter, Larry B. Wallnau
Publisher:Cengage Learning

Elementary Statistics: Picturing the World (7th E...
Statistics
ISBN:9780134683416
Author:Ron Larson, Betsy Farber
Publisher:PEARSON

The Basic Practice of Statistics
Statistics
ISBN:9781319042578
Author:David S. Moore, William I. Notz, Michael A. Fligner
Publisher:W. H. Freeman

Introduction to the Practice of Statistics
Statistics
ISBN:9781319013387
Author:David S. Moore, George P. McCabe, Bruce A. Craig
Publisher:W. H. Freeman