Calculus: Early Transcendentals
8th Edition
ISBN: 9781285741550
Author: James Stewart
Publisher: Cengage Learning
expand_more
expand_more
format_list_bulleted
Concept explainers
Question
Help me please

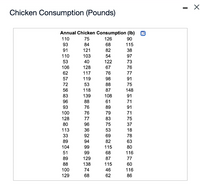
Transcribed Image Text:Chicken Consumption (Pounds)
Annual Chicken Consumption (Ib)
110
75
126
90
93
84
68
115
91
121
82
38
110
103
54
97
53
40
122
73
106
128
67
76
62
117
76
77
57
119
98
91
72
53
88
75
56
118
87
148
83
139
108
91
96
88
61
71
93
76
89
91
100
76
79
71
128
80
77
83
75
96
75
37
113
36
53
18
33
92
69
78
89
94
82
63
104
99
115
80
51
99
68
116
89
129
87
77
88
138
115
60
100
74
46
116
129
68
62
86

Transcribed Image Text:The per capita consumption of chicken rose from 36.9 pounds in 1965 to 90.1 pounds in 2015 according to a chicken advocacy group. Suppose the organization wishes to estimate the mean chicken consumption for the year 2016. The
accompanying table contains the data. Complete parts a and b below.
E Click the icon to view the data on annual chicken consumption.
a. Calculate the mean and standard deviation of the amount of chicken consumed by the individuals in the sample.
The mean is
Ib.
(Round to three decimal places as needed.)
The standard deviation is
Ib.
(Round to three decimal places as needed.)
b. Calculate a 99% confidence interval for the 2016 per capita consumption of chicken.
The 99% confidence interval is
Ib-
Ib.
(Round to three decimal places as needed.)
Expert Solution
This question has been solved!
Explore an expertly crafted, step-by-step solution for a thorough understanding of key concepts.
This is a popular solution
Trending nowThis is a popular solution!
Step by stepSolved in 2 steps

Knowledge Booster
Learn more about
Need a deep-dive on the concept behind this application? Look no further. Learn more about this topic, calculus and related others by exploring similar questions and additional content below.Similar questions
arrow_back_ios
arrow_forward_ios
Recommended textbooks for you
 Calculus: Early TranscendentalsCalculusISBN:9781285741550Author:James StewartPublisher:Cengage Learning
 Thomas' Calculus (14th Edition)CalculusISBN:9780134438986Author:Joel R. Hass, Christopher E. Heil, Maurice D. WeirPublisher:PEARSON
 Calculus: Early Transcendentals (3rd Edition)CalculusISBN:9780134763644Author:William L. Briggs, Lyle Cochran, Bernard Gillett, Eric SchulzPublisher:PEARSON
 Calculus: Early TranscendentalsCalculusISBN:9781319050740Author:Jon Rogawski, Colin Adams, Robert FranzosaPublisher:W. H. Freeman
 Calculus: Early Transcendental FunctionsCalculusISBN:9781337552516Author:Ron Larson, Bruce H. EdwardsPublisher:Cengage Learning

Calculus: Early Transcendentals
Calculus
ISBN:9781285741550
Author:James Stewart
Publisher:Cengage Learning

Thomas' Calculus (14th Edition)
Calculus
ISBN:9780134438986
Author:Joel R. Hass, Christopher E. Heil, Maurice D. Weir
Publisher:PEARSON

Calculus: Early Transcendentals (3rd Edition)
Calculus
ISBN:9780134763644
Author:William L. Briggs, Lyle Cochran, Bernard Gillett, Eric Schulz
Publisher:PEARSON

Calculus: Early Transcendentals
Calculus
ISBN:9781319050740
Author:Jon Rogawski, Colin Adams, Robert Franzosa
Publisher:W. H. Freeman


Calculus: Early Transcendental Functions
Calculus
ISBN:9781337552516
Author:Ron Larson, Bruce H. Edwards
Publisher:Cengage Learning