MATLAB: An Introduction with Applications
6th Edition
ISBN: 9781119256830
Author: Amos Gilat
Publisher: John Wiley & Sons Inc
expand_more
expand_more
format_list_bulleted
Question

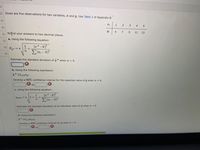
Transcribed Image Text:Given are five observations for two variables, and y. Use Table 2 of Appendix B.
O
Xi
1
Yi
O Round your answers to two decimal places.
a. Using the following equation:
1
S₁ = 8 +
(x*-=)²
Σ(x₁ - x)²
n
Estimate the standard deviation of * when = 4.
b. Using the following expression:
ŷta/28
Develop a 95% confidence interval for the expected value of y when z = 4.
to
c. Using the following equation:
1
8pred=8 1+
+
72
Σ( – =)
Estimate the standard deviation of an individual value of y when z=4.
d. Using the following expression:
ŷ* ±to/28 pred
Develop a 95% prediction interval for y when a = 4.
to
4
2
7
3
4 5
5 11 13
Expert Solution
This question has been solved!
Explore an expertly crafted, step-by-step solution for a thorough understanding of key concepts.
This is a popular solution
Trending nowThis is a popular solution!
Step by stepSolved in 2 steps with 1 images

Knowledge Booster
Similar questions
- answer 1arrow_forwardOn an exam with µ = 52, a person has a score of X = 44. Which value for the standard deviation would give this person the highest position in the class distribution? Group of answer choices σ = 2 σ = 4 σ = 8 This is impossible to determine based on the information provided..arrow_forwardTo compare the dry braking distances from 30 to 0 miles per hour for two makes of automobiles, a safety engineer conducts braking tests for 35 models of Make A and 35 models of Make B. The mean braking distance for Make A is 43 feet. Assume the population standard deviation is 4.6 feet. The mean braking distance for Make B is 46 feet. Assume the population standard deviation is 4.5 feet. At α=0.10, can the engineer support the claim that the mean braking distances are different for the two makes of automobiles? Assume the samples are random and independent, and the populations are normally distributed. The critical value(s) is/are Find the standardized test statistic z for μ1−μ2.arrow_forward
- answer 3arrow_forwardPlease use the following information to answer question 9a & 9b: A random sample of n = 16 scores is obtained from a population with a mean of µ = 45. After a treatment is administered to the individuals in the sample, the sample mean is found to be x̅ = 49.2. 9a. Assuming that the sample standard deviation is s = 20, calculate r2 (MUST SHOW WORK FOR THIS PROBLEM). Note: You must provide calculations for the t-statistic, in addition to r2. 9b. Calculate Cohen's d to measure the size of the treatment effect (MUST SHOW WORK FOR THIS PROBLEM). Comparing your answers from 8 (a&b) and 9 (a&b), fill in the blank to properly describe how the variability of scores in the sample influence the measures of effect size. (8. A random sample of n = 16 scores is obtained from a population with a mean of µ = 45. After a treatment is administered to the individuals in the sample, the sample mean is found to be x̅ = 49.2. 9. A random sample of n = 16 scores is obtained from a…arrow_forward4:40 Amylab.pearson.com Identify the symbols used for each of the following: (a) sample standard deviation; (b) population standard deviation; (c) sample variance; (d) population variance. If sample data consist of weights measured in grams, what units are used for these statistics and parameters? a. The symbol for sample standard deviation is b. The symbol for population standard deviation is c. The symbol for sample variance is d. The symbol for population variance isarrow_forward
- Ee.79. Suppose that a car races down a ¼-mile drag strip several times and that it takes an average of 11.4 s to do so. If the standard deviation is σ=0.2 s, what fraction (or percent) of the measurements would you expect to be between 11.3 s and 11.5 s?arrow_forwardA sample of 126 was found to have a standard deviation of 5.9. An interval estimate for ?μ based on the sample was (27.576, 29.464). What is the margin of error from this estimate? What was the ??,?tν,α that was used to get this interval extimate?arrow_forwardUse calculator t3 .arrow_forward
arrow_back_ios
arrow_forward_ios
Recommended textbooks for you
 MATLAB: An Introduction with ApplicationsStatisticsISBN:9781119256830Author:Amos GilatPublisher:John Wiley & Sons Inc
 Probability and Statistics for Engineering and th...StatisticsISBN:9781305251809Author:Jay L. DevorePublisher:Cengage Learning
 Statistics for The Behavioral Sciences (MindTap C...StatisticsISBN:9781305504912Author:Frederick J Gravetter, Larry B. WallnauPublisher:Cengage Learning
 Elementary Statistics: Picturing the World (7th E...StatisticsISBN:9780134683416Author:Ron Larson, Betsy FarberPublisher:PEARSON
 The Basic Practice of StatisticsStatisticsISBN:9781319042578Author:David S. Moore, William I. Notz, Michael A. FlignerPublisher:W. H. Freeman
 Introduction to the Practice of StatisticsStatisticsISBN:9781319013387Author:David S. Moore, George P. McCabe, Bruce A. CraigPublisher:W. H. Freeman

MATLAB: An Introduction with Applications
Statistics
ISBN:9781119256830
Author:Amos Gilat
Publisher:John Wiley & Sons Inc

Probability and Statistics for Engineering and th...
Statistics
ISBN:9781305251809
Author:Jay L. Devore
Publisher:Cengage Learning

Statistics for The Behavioral Sciences (MindTap C...
Statistics
ISBN:9781305504912
Author:Frederick J Gravetter, Larry B. Wallnau
Publisher:Cengage Learning

Elementary Statistics: Picturing the World (7th E...
Statistics
ISBN:9780134683416
Author:Ron Larson, Betsy Farber
Publisher:PEARSON

The Basic Practice of Statistics
Statistics
ISBN:9781319042578
Author:David S. Moore, William I. Notz, Michael A. Fligner
Publisher:W. H. Freeman

Introduction to the Practice of Statistics
Statistics
ISBN:9781319013387
Author:David S. Moore, George P. McCabe, Bruce A. Craig
Publisher:W. H. Freeman