MATLAB: An Introduction with Applications
6th Edition
ISBN: 9781119256830
Author: Amos Gilat
Publisher: John Wiley & Sons Inc
expand_more
expand_more
format_list_bulleted
Question

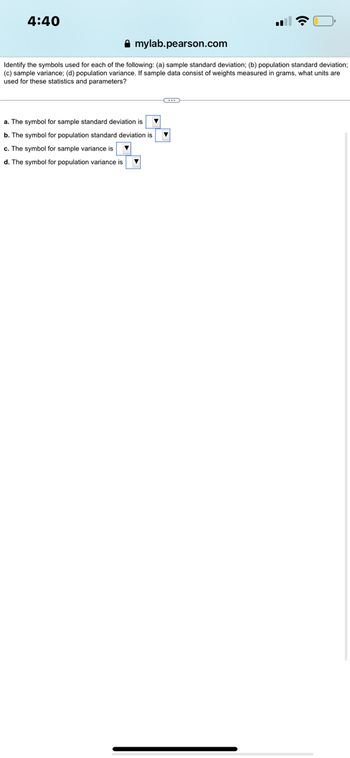
Transcribed Image Text:4:40
Amylab.pearson.com
Identify the symbols used for each of the following: (a) sample standard deviation; (b) population standard deviation;
(c) sample variance; (d) population variance. If sample data consist of weights measured in grams, what units are
used for these statistics and parameters?
a. The symbol for sample standard deviation is
b. The symbol for population standard deviation is
c. The symbol for sample variance is
d. The symbol for population variance is
Expert Solution
This question has been solved!
Explore an expertly crafted, step-by-step solution for a thorough understanding of key concepts.
Step by stepSolved in 3 steps

Knowledge Booster
Similar questions
- Calculate the range, variance and standard deviation for the following sample data. Scores: 10, 7, 9, 1, 2, 0, 6arrow_forwardA primary measure of dispersion for sample data is the sample standard deviation, s. Choose the best option to explain what the meaning of the sample standard deviation is, in general. A. The distance between one observation and the mean. B. The average distance of an observation from the middle of the distribution. C. The average distance between observations in the sample. D. The distance between the third and first quartiles.arrow_forwardFind the standard deviation of the sample data below: 3,5,6,9 (Answer: 1 decimal place) Type your answer... Previousarrow_forward
- Compare the population variance to the mean of the sample variances. Choose the correct answer below. A. The population variance is equal to the square root of the mean of the sample variances. B. The population variance is equal to the mean of the sample variances. C. The population variance is equal to the square of the mean of the sample variances.arrow_forwardsolve a and barrow_forwardThe histogram (click the attacthed photo to view) shows the distribution of hurricanes that have hit a country from 1851 through 2015, where 1 is the weakest level and 5 is the strongest level. A) The mean is? B) The variance is? C)The standard deviation is?arrow_forward
- A. Sam's times varied more over the season that Mike's times. B. Sam's times varied about the same over the season as Brett's times. C. Brett's times varied more over the season than Mike's times. D. Mike's times varied more over the season than Brett's times.arrow_forwardFind the population variance and standard deviation as indicated: Population: 4,10,12,12,13,21arrow_forwardFind the sample mean x̄, median, variance s2, and standard deviation s of the following data: 15 10 25 12 40arrow_forward
arrow_back_ios
arrow_forward_ios
Recommended textbooks for you
 MATLAB: An Introduction with ApplicationsStatisticsISBN:9781119256830Author:Amos GilatPublisher:John Wiley & Sons Inc
 Probability and Statistics for Engineering and th...StatisticsISBN:9781305251809Author:Jay L. DevorePublisher:Cengage Learning
 Statistics for The Behavioral Sciences (MindTap C...StatisticsISBN:9781305504912Author:Frederick J Gravetter, Larry B. WallnauPublisher:Cengage Learning
 Elementary Statistics: Picturing the World (7th E...StatisticsISBN:9780134683416Author:Ron Larson, Betsy FarberPublisher:PEARSON
 The Basic Practice of StatisticsStatisticsISBN:9781319042578Author:David S. Moore, William I. Notz, Michael A. FlignerPublisher:W. H. Freeman
 Introduction to the Practice of StatisticsStatisticsISBN:9781319013387Author:David S. Moore, George P. McCabe, Bruce A. CraigPublisher:W. H. Freeman

MATLAB: An Introduction with Applications
Statistics
ISBN:9781119256830
Author:Amos Gilat
Publisher:John Wiley & Sons Inc

Probability and Statistics for Engineering and th...
Statistics
ISBN:9781305251809
Author:Jay L. Devore
Publisher:Cengage Learning

Statistics for The Behavioral Sciences (MindTap C...
Statistics
ISBN:9781305504912
Author:Frederick J Gravetter, Larry B. Wallnau
Publisher:Cengage Learning

Elementary Statistics: Picturing the World (7th E...
Statistics
ISBN:9780134683416
Author:Ron Larson, Betsy Farber
Publisher:PEARSON

The Basic Practice of Statistics
Statistics
ISBN:9781319042578
Author:David S. Moore, William I. Notz, Michael A. Fligner
Publisher:W. H. Freeman

Introduction to the Practice of Statistics
Statistics
ISBN:9781319013387
Author:David S. Moore, George P. McCabe, Bruce A. Craig
Publisher:W. H. Freeman