MATLAB: An Introduction with Applications
6th Edition
ISBN: 9781119256830
Author: Amos Gilat
Publisher: John Wiley & Sons Inc
expand_more
expand_more
format_list_bulleted
Question

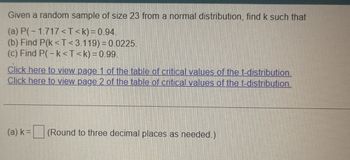
Transcribed Image Text:Given a random sample of size 23 from a normal distribution, find k such that
(a) P(-1.717<T<k) = 0.94.
(b) Find P(k<T<3.119)=0.0225.
(c) Find P(-k<T<k) = 0.99.
Click here to view page 1 of the table of critical values of the t-distribution.
Click here to view page 2 of the table of critical values of the t-distribution.
(a) k=
(Round to three decimal places as needed.)
Expert Solution
This question has been solved!
Explore an expertly crafted, step-by-step solution for a thorough understanding of key concepts.
Step by stepSolved in 2 steps with 2 images

Knowledge Booster
Similar questions
- Previous studies have suggested that human body temperature is normally distributed with a mean of 98.6∘98.6∘ F and a standard deviation of 0.7∘0.7∘ F. You sample 75 random humans and find ¯x=97.1∘x¯=97.1∘ F. To estimate the typical human's body temperature,we should use: 2-PropZInt 2-SampZInt 2-SampTInt ZInterval TInterval 1-PropZIntarrow_forwardSuppose x has a distribution with a mean of 90 and a standard deviation of 12. Tandom samples of size n=64 are drawn. Describe the x distribution and compute the mean and standard deviation of the distribution.arrow_forwardIn a Normal Distribution with the Mean of 77 and the Standard Deviation of 5 , find P ( x>66)arrow_forward
- Suppose x has a distribution with a mean of 65 and a standard deviation of 36. Random sample size n= 81 are drawn. Describe the x distribution and compute the mean and standard deviation of the distribution. Find the z value corresponding to x=77. Find p(x<77). Would it be unusual for a random sample of size 81 from the x distribution to have a sample mean less than 77arrow_forwardA normal distribution has μ = 30 and σ = 5. (a) Find the z score corresponding to x = 25. (Enter an exact number.) (b) Find the z score corresponding to x = 44. (Enter a number.) (c) Find the raw score corresponding to z = −3. (Enter an exact number.) (d) Find the raw score corresponding to z = 1.5. (Enter a number.)arrow_forwardPlease assist with all questions and add R script as well.arrow_forward
- The noon-day temperature (in °C) in Ajax last winter can be represented by the normal distribution X~N( 6, 62). How often was it above - 3°C at noon in Ajax last winter? Make a sketch.arrow_forwardThe heights of fully grown trees of a specific species are normally distributed, with a mean of 54.5 feet and a standard deviation of 5.75 feet. Random samples of size 19 are drawn from the population. Use the central limit theorem to find the mean and standard error of the sampling distribution. Then sketch a graph of the sampling distribution. The mean of the sampling distribution is u- %3D The standard error of the sampling distribution is o, = X. (Round to two decimal places as needed.) Choose the correct graph of the sampling distribution below. O A. В. OC. 2. 51.9 54.5 57.1 43.0 54.5 66.0arrow_forwardFor an F-distribution, find (a) f0.05 with v₁ = 6 and v₂ = 8; (b) f0.05 with V₁ = 8 and v₂ = 6; (c) f0.01 with V₁ = 10 and v₂ = 24; (d) fo.95 with v₁ = 24 and v₂ = 10; (e) fo.99 with V₁ = 7 and v₂ = 9. Click here to view page 1 of the table of critical values of the f-distribution, for alpha = 0.01. Click here to view page 2 of the table of critical values of the f-distribution, for alpha = 0.01. Click here to view page 1 of the table of critical values of the f-distribution, for alpha = 0.05. Click here to view page 2 of the table of critical values of the f-distribution, for alpha = 0.05. ... (a) f0.05 = (Round to two decimal places as needed.)arrow_forward
arrow_back_ios
arrow_forward_ios
Recommended textbooks for you
 MATLAB: An Introduction with ApplicationsStatisticsISBN:9781119256830Author:Amos GilatPublisher:John Wiley & Sons Inc
 Probability and Statistics for Engineering and th...StatisticsISBN:9781305251809Author:Jay L. DevorePublisher:Cengage Learning
 Statistics for The Behavioral Sciences (MindTap C...StatisticsISBN:9781305504912Author:Frederick J Gravetter, Larry B. WallnauPublisher:Cengage Learning
 Elementary Statistics: Picturing the World (7th E...StatisticsISBN:9780134683416Author:Ron Larson, Betsy FarberPublisher:PEARSON
 The Basic Practice of StatisticsStatisticsISBN:9781319042578Author:David S. Moore, William I. Notz, Michael A. FlignerPublisher:W. H. Freeman
 Introduction to the Practice of StatisticsStatisticsISBN:9781319013387Author:David S. Moore, George P. McCabe, Bruce A. CraigPublisher:W. H. Freeman

MATLAB: An Introduction with Applications
Statistics
ISBN:9781119256830
Author:Amos Gilat
Publisher:John Wiley & Sons Inc

Probability and Statistics for Engineering and th...
Statistics
ISBN:9781305251809
Author:Jay L. Devore
Publisher:Cengage Learning

Statistics for The Behavioral Sciences (MindTap C...
Statistics
ISBN:9781305504912
Author:Frederick J Gravetter, Larry B. Wallnau
Publisher:Cengage Learning

Elementary Statistics: Picturing the World (7th E...
Statistics
ISBN:9780134683416
Author:Ron Larson, Betsy Farber
Publisher:PEARSON

The Basic Practice of Statistics
Statistics
ISBN:9781319042578
Author:David S. Moore, William I. Notz, Michael A. Fligner
Publisher:W. H. Freeman

Introduction to the Practice of Statistics
Statistics
ISBN:9781319013387
Author:David S. Moore, George P. McCabe, Bruce A. Craig
Publisher:W. H. Freeman