
MATLAB: An Introduction with Applications
6th Edition
ISBN: 9781119256830
Author: Amos Gilat
Publisher: John Wiley & Sons Inc
expand_more
expand_more
format_list_bulleted
Related questions
Question
thumb_up100%
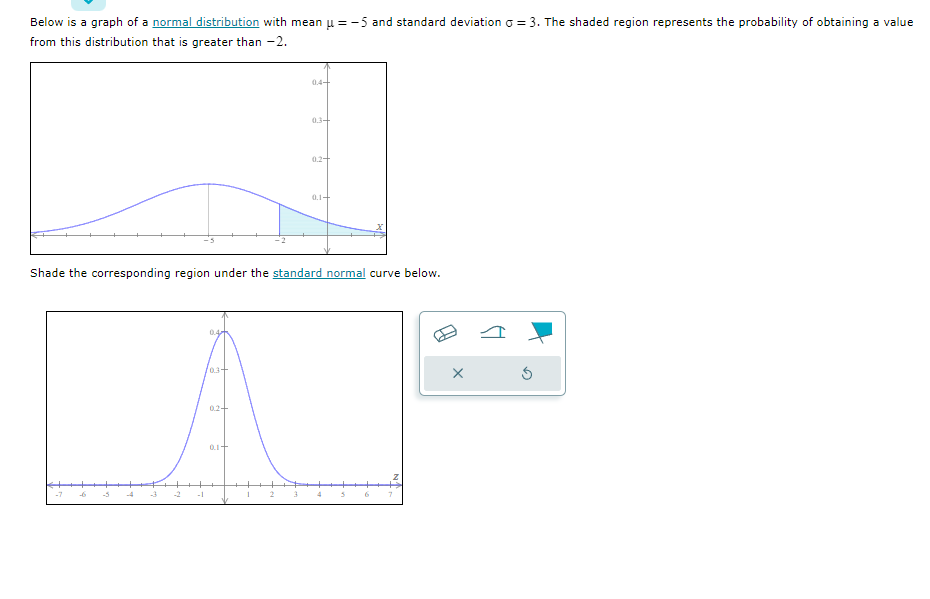

Transcribed Image Text:Below is a graph of a normal distribution with mean μ = -5 and standard deviation = 3. The shaded region represents the probability of obtaining a value
from this distribution that is greater than -2.
0.4
103+
0.2+
04-
Shade the corresponding region under the standard normal curve below.
0.1+
034
0.2+
0.1+
X
Expert Solution
This question has been solved!
Explore an expertly crafted, step-by-step solution for a thorough understanding of key concepts.

This is a popular solution

Trending nowThis is a popular solution!

Step by stepSolved in 3 steps with 1 images

Knowledge Booster

Similar questions
- Below is a graph of a normal distribution with mean u=5 and standard deviation o=2. The shaded region represents the probability of obtaining a value from this distribution that is less than 7. Shade the corresponding region under the standard normal curve below. 02+arrow_forwardFor a recent English exam, use the Normal model N(73, 9.2) to find the proportion of scores under 58. Round to three decimal places. N(x,s) indicates the normal distribution with mean x and standard deviation s.arrow_forwardBelow is a graph of a normal distribution with mean u=-3 and standard deviation o=2. The shaded region represents the probability of obtaining a value from this distribution that is greater than -4. 0.4 0.3+ 0.2+ 0.4+ Shade the corresponding region under the standard normal curve below. 0.1+ 0.3+ 0.2+ 0.1+ Xarrow_forward
- A population forms a normal distribution with a mean of 85 and a standard deviation of 24 compute the Z score for the sample mean M equals 91 for N equals 16 scores Z equals whatarrow_forwardA normal distribution has a mean of μ = 100 with σ = 20. If one score is randomly selected from this distribution, what is the probability that the score will have a value between X = 100 and X = 130?arrow_forwardBelow is a graph of a normal distribution with mean μ--3 and standard deviation o=2. The shaded region represents the probability of obtaining a value from this distribution that is greater than -5. -4 -3 -2 Shade the corresponding region under the standard normal curve below. -1 0.4- 0.3- 0.2+ 0.4+ 0.1+ 0.3- 0.2+ 0.1+ 2 3 4 N 5arrow_forward
- A normal distribution has a mean of µ = 100 with σ = 20. If one score is randomly selected from this distribution, what is the probability that the score will have a value between X = 90 and X = 110?arrow_forwardIn a Normal Distribution with the Mean of 77 and the Standard Deviation of 5 , find P ( x>66)arrow_forward4. (Normal Distribution) Setup: Define za to be a z-score with an area of a to the right. For example: 20.10 means P(Z > 20.10) = 0.10. We would also have, for example: P(Z Z) = 0.057. Hint: It may help to draw a picture of what you want to find. Zo.10 1 I P(Z > Zo.10) 0.10 Larrow_forward
- (a) The graph shows a Standard Normal Distribution. You are given 1 or 2 z-score(s) and need to shade the area (=probability) corresponding to: Р(г < 1.6). Click on the "Shade" menu to select the shading option corresponding to the question [to the left, to the right, or between 2 values]. Then slide the arrow to the appropriate z-score. Shade: Left of a value v. Click and drag the arrows to adjust the values. -3 -2 -1 2 4 -1.5 (b) Part 2: you are given an area (=probability), and you need to compute c, which is the z-score that corresponds to the statement: P(z < c) = 0.4 (This is an inverse standard normal distribution problem. Use technology to compute c) The arrow can only be dragged to tick marks that are multiples of 0.1 So, round c to 1 decimal place, and then move the arrow to that rounded value. Click on the "Shade" menu to select the shading option corresponding to the question [to the left, to the right, or between 2 values]. (If the question is less c, choose Left of a…arrow_forwardFawns between 1 and 5 months old have a body weight that is approximately normally distributed with mean ? = 27.1 kilograms and standard deviation ? = 4.0 kilograms. Let x be the weight of a fawn in kilograms.arrow_forwardThe lengths of pregnancies in a small rural village are normally distributed with a mean of 261 days and a standard deviation of 17 days. What percentage of pregnancies last fewer than 314 days? P(x < 314 days) = P(z<arrow_forward
arrow_back_ios
SEE MORE QUESTIONS
arrow_forward_ios
Recommended textbooks for you
- MATLAB: An Introduction with ApplicationsStatisticsISBN:9781119256830Author:Amos GilatPublisher:John Wiley & Sons Inc
 Probability and Statistics for Engineering and th...StatisticsISBN:9781305251809Author:Jay L. DevorePublisher:Cengage Learning
 Statistics for The Behavioral Sciences (MindTap C...StatisticsISBN:9781305504912Author:Frederick J Gravetter, Larry B. WallnauPublisher:Cengage Learning
  Elementary Statistics: Picturing the World (7th E...StatisticsISBN:9780134683416Author:Ron Larson, Betsy FarberPublisher:PEARSON
 The Basic Practice of StatisticsStatisticsISBN:9781319042578Author:David S. Moore, William I. Notz, Michael A. FlignerPublisher:W. H. Freeman
 Introduction to the Practice of StatisticsStatisticsISBN:9781319013387Author:David S. Moore, George P. McCabe, Bruce A. CraigPublisher:W. H. Freeman
MATLAB: An Introduction with Applications
Statistics
ISBN:9781119256830
Author:Amos Gilat
Publisher:John Wiley & Sons Inc
Probability and Statistics for Engineering and th...
Statistics
ISBN:9781305251809
Author:Jay L. Devore
Publisher:Cengage Learning
Statistics for The Behavioral Sciences (MindTap C...
Statistics
ISBN:9781305504912
Author:Frederick J Gravetter, Larry B. Wallnau
Publisher:Cengage Learning
Elementary Statistics: Picturing the World (7th E...
Statistics
ISBN:9780134683416
Author:Ron Larson, Betsy Farber
Publisher:PEARSON
The Basic Practice of Statistics
Statistics
ISBN:9781319042578
Author:David S. Moore, William I. Notz, Michael A. Fligner
Publisher:W. H. Freeman
Introduction to the Practice of Statistics
Statistics
ISBN:9781319013387
Author:David S. Moore, George P. McCabe, Bruce A. Craig
Publisher:W. H. Freeman