Human Anatomy & Physiology (11th Edition)
11th Edition
ISBN: 9780134580999
Author: Elaine N. Marieb, Katja N. Hoehn
Publisher: PEARSON
expand_more
expand_more
format_list_bulleted
Concept explainers
Topic Video
Question

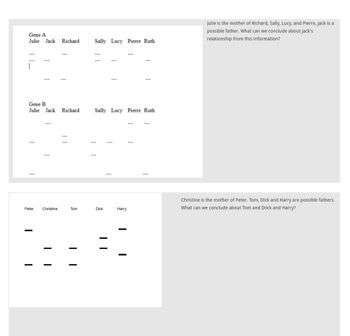
Transcribed Image Text:**Transcription for Educational Website**
**Image Explanation and Analysis**
The image consists of two sections that appear to be related to genetic analysis, perhaps regarding paternity or genetic inheritance patterns.
**Upper Section:**
This section includes two tables labeled as "Gene A" and "Gene B". Each table displays names along the top row: Julie, Jack, Richard, Sally, Lucy, Pierre, and Ruth. Below each name, there are dashed lines indicating genetic markers.
- **Gene A Table:**
- The first name row is filled with dashed lines under each name.
- The second name row includes an empty space under the name "Julie."
- **Gene B Table:**
- This table shows dashed lines under each name with no additional markers.
The accompanying text states:
"Julie is the mother of Richard, Sally, Lucy, and Pierre, Jack is a possible father. What can we conclude about Jack's relationship from this information?"
This suggests a context of determining Jack's genetic relationship (likely paternity) to Julie's children.
**Lower Section:**
The lower section features a graphical representation of markers. The names Peter, Christine, Tom, Dick, and Harry are each aligned over columns with horizontal lines representing genetic markers.
- The arrangement and length of lines vary, suggesting differences in genetic markers.
- Suggests a comparison or analysis to determine genetic connections.
The accompanying text states:
"Christine is the mother of Peter. Tom, Dick, and Harry are possible fathers. What can we conclude about Tom, Dick, and Harry?"
This context suggests an analysis to identify which of the possible fathers (Tom, Dick, or Harry) matches Peter's genetic markers, determining paternity.
**Conclusion:**
The diagrams and explanations focus on inferring genetic relationships using genetic markers, possibly in a lesson on genetics, inheritance, or DNA analysis. The emphasis lies in identifying parental relationships through genetic comparison.

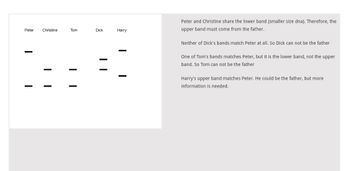
Transcribed Image Text:**DNA Band Analysis: Understanding Parentage**
The image displays a DNA banding pattern analysis for five individuals: Peter, Christine, Tom, Dick, and Harry. These bands represent different DNA fragments that can help determine familial relationships.
**Graph Analysis:**
- **Peter**: Two bands visible; one shared with Christine.
- **Christine**: Matches the lower band with Peter.
- **Tom**: Two bands; one matches Christine and Peter's lower band.
- **Dick**: Two bands; neither matches Peter.
- **Harry**: One band matches Peter's upper band.
**Interpretation:**
- **Peter and Christine** share the lower band (indicating smaller-sized DNA). The upper band in Peter must be of paternal origin.
- **Dick**: No matching bands with Peter, excluding him as the potential father.
- **Tom**: Shares the lower band, similar to Christine, but the upper band still requires a different origin. Therefore, Tom is not the father.
- **Harry**: The upper band matches Peter, suggesting Harry could be the father, but additional evidence is required for confirmation.
This analysis helps illustrate the importance of comparing DNA fragments in determining biological relationships.
Expert Solution
This question has been solved!
Explore an expertly crafted, step-by-step solution for a thorough understanding of key concepts.
This is a popular solution
Trending nowThis is a popular solution!
Step by stepSolved in 2 steps

Knowledge Booster
Learn more about
Need a deep-dive on the concept behind this application? Look no further. Learn more about this topic, biology and related others by exploring similar questions and additional content below.Similar questions
- mark has blood type b and angela has blood type a angela give birth to a child with blood type o mark accuses her of cheating. Show the possible crosses blow does the child belong to mark was angela faithful?arrow_forwardCathy is pregnant for the second time. Her first child, Donald, has cystic fibrosis. Cathy has two brothers Charles and Colin, and a sister, Cindy. Colin and Cindy are unmarried. Charles is married to an unrelated woman, Carolyn, and has a 2-year old daughter, Debbie. Cathy's parents are Bob and Betty. Betty's sister Barbara is the mother of Cathy's husband, Calvin, who is 25. There is no previous family history of CF. Assume that everyone in this family is of Northern European Origin. D. What is the chance of Charles having a child with cystic fibrosis? Show your work.arrow_forwardComplete the following blanks with the following word bank:arrow_forward
- please dont copy other answers and give your own answer. i will dislike if you dont follow what i saidarrow_forwardd/1n5NtidRwTwUzcDkDPi5Z9P SHPZ9IA-XH-pfftLbhNc/edit 1) @ Is Add-ons Help Last edit was 15 minutes ago | Calibri в I UA 12 + 3I | II 6 1 I 7. Construct a Punnett square for a cross between two heterozygous pea plants with violet flower color. a. What genotypes would you expect in the offspring? b. What percentage or ratio of each genotype would you expect in the offspring? !!!arrow_forwardPart A One result of X-linkage is a crisscross pattern of inheritance in which sons express recessive genes of their fathers and daughters express recessive genes of their mothers. O True O False Submit Provide Feedback Request Answer Copyright © 2023 Pearson Education Inc. All rights reserved. | Terms of Use | Privacy Policy | Permissions | Contact Us | View?assignment ProblemID=10436487&offset=next MacBook Pro P Pearson or tyne URL Next >arrow_forward
- Bob and Will are monozygotic (identical) twins. They are 18 years old and in their first year the liberal arts college that their parents attended. Their parents are Robert Senior (age 55) and Jane (age 48). They had one miscarriage during the first pregnancy. Bob and Will have a younger sister (Su, age 12). 11 months after the birth of Su, Jane had a second miscarriage. Jane was adopted by her parents and has an unknown history of her birth family. Robert Senior parents are Samuel (age 88) and Mary (deceased at age 60 from a stroke). Both Samuel and Mary smoked cigarettes since age 18 and Samuel has COPD and uses supplemental oxygen. Robert Senior has two brothers, Nick (age 56) and Tony (52). Tony is incarcerated for multiple car thefts. He has a history of violent behavior. Both Bob and Will have been experimenting with drugs at college. In the last month or so, Bob’s work has fallen off. He has not been completing assignments at his usual high level of quality. His thoughts seem to…arrow_forwardHow do I construct these punnets squares?arrow_forwardWhat is the karyotype for men who have an extra Y chromosome? Discuss all the ways you can test for this abnormality.arrow_forward
arrow_back_ios
arrow_forward_ios
Recommended textbooks for you
 Human Anatomy & Physiology (11th Edition)BiologyISBN:9780134580999Author:Elaine N. Marieb, Katja N. HoehnPublisher:PEARSON
 Biology 2eBiologyISBN:9781947172517Author:Matthew Douglas, Jung Choi, Mary Ann ClarkPublisher:OpenStax
 Anatomy & PhysiologyBiologyISBN:9781259398629Author:McKinley, Michael P., O'loughlin, Valerie Dean, Bidle, Theresa StouterPublisher:Mcgraw Hill Education,
 Molecular Biology of the Cell (Sixth Edition)BiologyISBN:9780815344322Author:Bruce Alberts, Alexander D. Johnson, Julian Lewis, David Morgan, Martin Raff, Keith Roberts, Peter WalterPublisher:W. W. Norton & Company
 Laboratory Manual For Human Anatomy & PhysiologyBiologyISBN:9781260159363Author:Martin, Terry R., Prentice-craver, CynthiaPublisher:McGraw-Hill Publishing Co.
 Inquiry Into Life (16th Edition)BiologyISBN:9781260231700Author:Sylvia S. Mader, Michael WindelspechtPublisher:McGraw Hill Education

Human Anatomy & Physiology (11th Edition)
Biology
ISBN:9780134580999
Author:Elaine N. Marieb, Katja N. Hoehn
Publisher:PEARSON

Biology 2e
Biology
ISBN:9781947172517
Author:Matthew Douglas, Jung Choi, Mary Ann Clark
Publisher:OpenStax

Anatomy & Physiology
Biology
ISBN:9781259398629
Author:McKinley, Michael P., O'loughlin, Valerie Dean, Bidle, Theresa Stouter
Publisher:Mcgraw Hill Education,

Molecular Biology of the Cell (Sixth Edition)
Biology
ISBN:9780815344322
Author:Bruce Alberts, Alexander D. Johnson, Julian Lewis, David Morgan, Martin Raff, Keith Roberts, Peter Walter
Publisher:W. W. Norton & Company

Laboratory Manual For Human Anatomy & Physiology
Biology
ISBN:9781260159363
Author:Martin, Terry R., Prentice-craver, Cynthia
Publisher:McGraw-Hill Publishing Co.

Inquiry Into Life (16th Edition)
Biology
ISBN:9781260231700
Author:Sylvia S. Mader, Michael Windelspecht
Publisher:McGraw Hill Education