
ENGR.ECONOMIC ANALYSIS
14th Edition
ISBN: 9780190931919
Author: NEWNAN
Publisher: Oxford University Press
expand_more
expand_more
format_list_bulleted
Related questions
Question
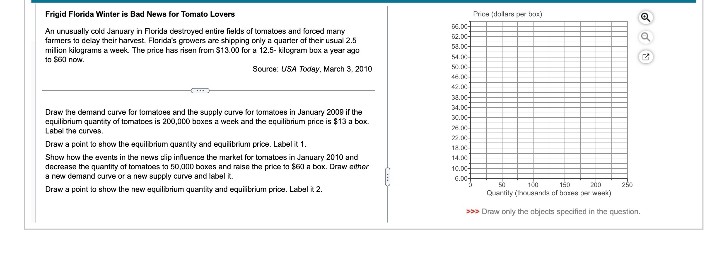

Transcribed Image Text:Frigid Florida Winter is Bad News for Tomato Lovers
An unusually cold January in Florida destroyed entire fields of tomatoes and forced marry
farmers to delay their harvest. Florida's growers are shipping only a quarter of their usual 2.5
million kilograms a week. The price has risen from $13.00 for a 12.5-kilogram bux a year ago
in S60 now.
Source: USA Today, March 3. 2010
Draw the demand curve for tomatoes and the supply curve for tomatoes in January 2009 if the
equilibrium quantity of tomatoes is 200,000 boxes a week and the equilibrium price is $13 a box.
Label the curvas.
Draw a point to show the equilibrium quantity and equilibrium price. Label it 1.
Show how the events in the news clip influence the market for tomatoes in January 2010 and
decrease the quantity of tomatoes to 50,000 boxes and raise the price to $60 a box. Draw ather
a new cemand curve or a new supply curve and label it.
Draw a point to show the new equilibrium quantity and equilibrium price. Label it 2.
se.xcF
52.00-
58.00-
54.00-
46.00
42.00
38.00-
34.00+
30.00-
28.00
Price dolars per box)
18.00
14.00
10.00-
€.00+
250
100 150
Quantity (hands of homes per week)
>>> Draw only the objects specified in the question.

Transcribed Image Text:Frigid Florida Winter is Bad News for Tomato Lovers An unusually cold January in Florida destroyed entire
fields of tomatoes and forced many farmers to delay their harvest. Florida's growers are shipping only a
quarter of their usual 2.5 million kilograms a week. The price has risen from $13.00 for a 12.5 - kilogram
box a year ago to $60 now. Source: USA Today, March 3, 2010 Draw the demand curve for tomatoes and
the supply curve for tomatoes in January 2009 if the equilibrium quantity of tomatoes is 200,000 boxes a
week and the equilibrium price is $13 a box. Label the curves. Draw a point to show the equilibrium
quantity and equilibrium price. Label it 1. Show how the events in the news clip influence the market for
tomatoes in January 2010 and decrease the quantity of tomatoes to 50,000 boxes and raise the price to $
60 a box. Draw either a new demand curve or a new supply curve and label it. Draw a point to show the
new equilibrium quantity and equilibrium price. Label it 2. Price (dollars per box) Draw only the objects
specified in the question.
Expert Solution
This question has been solved!
Explore an expertly crafted, step-by-step solution for a thorough understanding of key concepts.

This is a popular solution

Trending nowThis is a popular solution!

Step by stepSolved in 4 steps with 3 images

Knowledge Booster


Learn more about
Need a deep-dive on the concept behind this application? Look no further. Learn more about this topic, economics and related others by exploring similar questions and additional content below.Similar questions
- f the price of a haircut is $10, the number of haircuts provided is 200. If the price rises to $15 per haircut, barbers will work much longer hours, and the supply of haircuts will increase to 250. Instructions: Round your answer to two decimal places. The price elasticity of supply for haircuts between $10 and $15 using the mid-point method is.arrow_forward13. The variety of supply curves The following graph displays four supply curves (LL, MM, NN, and OO) that intersect at point V. PRICE (Dollars per unit) 20 18 16 14 12 10 8 4 2 0 10 M 2 4 N + 8 10 12 QUANTITY (Units) 14 16 M 18 20 (?)arrow_forwardA farmer produced 8400 tons of grapes and each ton sales for $200. Grapes are found to be a perfect cure for Corona Virus. As a result, the price of grapes went from $200 per ton to $10,000 per ton. How many tons will the farmer sale? Using your knowledge of price elasticity of supply, draw a graph illustrating this sale. What will happen in the market for grapes in one year if the price hold steady at $10, 000. Draw a graph showing this.arrow_forward
- 13. The table below gives part of the supply schedule for personal computers in the United States. Price Quantity Supplied before tech change Quantity Supplied after tech $1,100 $900 12,000 8,000 change 13,000 9,000 a) Calculate the price elasticity of supply when price rises from $900 to $1,100 using the arc elasticity formula (the midpoint method). b) Now suppose that technology changes such that at every price, 1000 more computers are supplied. Now, as prices rise from $900 to $1,100, is the elasticity of supply smaller than, larger than, or equal to the elasticity in part a)? c) Does the change in b) change the slope of the supply curve? Are slope and elasticity the same thing? Explain.arrow_forwardPrice of tin and silicone decrease affecting the market for iPhones A)Decrease in supply B)Decrease in demand C)Increase in supply D)Increase in demandarrow_forwardPlease only Typing answer I need ASAParrow_forward
- 13) . Consider the following supply schedule for shoes. Price Quantity Supplied $5 425 $10 445 $15 465 $20 485 $25 505 $30 525 $35 545 $40 565 Suppose that the price of shoes increases from $25 to $30. Using the mid-point approach, calculate price elasticity of supply.arrow_forwardSuppose the accompanying table contains data on how many Veggie Delite sandwiches Subway is willing to sell each day at two different prices. Calculate the daily price elasticity of supply when the price increases from $5.00 to $7.50. Please round to the nearest hundredth. Price(per sandwich) Quantity supplied(sandwiches per day) $5.00 200,000 $7.50 210,000 a. Daily price elasticity of supply for Veggie Delite sandwiches = b. The daily price elasticity of supply for Veggie Delite sandwiches is relatively Elastic or Inelastic Now consider how responsive Subway’s supply of Veggie Delite sandwiches is to changes in price on an annual basis instead of a daily basis. c. Compared to the daily value, the annual price elasticity of supply for Veggie Delite sandwiches is likely to be more Inelastic or Elastic and the annual supply curve is likely Flatter or Steeper to be than the daily supply curve.arrow_forward13. The variety of supply curves The following graph displays four supply curves (HH, II, JJ, and KK) that intersect at point A .arrow_forward
- 15. Market equilibrium The following table presents the weekly demand and supply in the market for sweatpants in Philadelphia. Price (Dollars per pair of sweatpants) 6 12 18 24 30 Quantity Demanded (Pairs of sweatpants) 1,650 1,350 1,200 900 750 Quantity Supplied (Pairs of sweatpants) 300 600 750 1,350 1,800 On the following graph, plot the demand for sweatpants using the blue point (circle symbol). Next, plot the supply of sweatpants using the orange point (square symbol). Finally, use the black point (plus symbol) to indicate the equilibrium price and quantity in the market for sweatpants. Note: Plot your points in the order in which you would like them connected. Line segments will connect the points automatically. Note:- Do not provide handwritten solution. Maintain accuracy and quality in your answer. Take care of plagiarism.Answer completely.You will get up vote for sure.arrow_forward9. In recent years, the number of car producers in China has increased rapidly. In fact, China now has more car brands than the United States. In addition, car sales have climbed every year and automakers have increased their output at even faster rates, causing fierce competition and a decline in prices. At the same time, Chinese consumers' incomes have risen. Assume that cars are a normal good. Draw a diagram of the supply and demand curves for cars in China to explain what has happened in the Chinese car market.arrow_forward26arrow_forward
arrow_back_ios
SEE MORE QUESTIONS
arrow_forward_ios
Recommended textbooks for you
 Principles of Economics (12th Edition)EconomicsISBN:9780134078779Author:Karl E. Case, Ray C. Fair, Sharon E. OsterPublisher:PEARSON
 Engineering Economy (17th Edition)EconomicsISBN:9780134870069Author:William G. Sullivan, Elin M. Wicks, C. Patrick KoellingPublisher:PEARSON
 Principles of Economics (MindTap Course List)EconomicsISBN:9781305585126Author:N. Gregory MankiwPublisher:Cengage Learning
 Managerial Economics: A Problem Solving ApproachEconomicsISBN:9781337106665Author:Luke M. Froeb, Brian T. McCann, Michael R. Ward, Mike ShorPublisher:Cengage Learning
 Managerial Economics & Business Strategy (Mcgraw-...EconomicsISBN:9781259290619Author:Michael Baye, Jeff PrincePublisher:McGraw-Hill Education
Principles of Economics (12th Edition)
Economics
ISBN:9780134078779
Author:Karl E. Case, Ray C. Fair, Sharon E. Oster
Publisher:PEARSON
Engineering Economy (17th Edition)
Economics
ISBN:9780134870069
Author:William G. Sullivan, Elin M. Wicks, C. Patrick Koelling
Publisher:PEARSON
Principles of Economics (MindTap Course List)
Economics
ISBN:9781305585126
Author:N. Gregory Mankiw
Publisher:Cengage Learning
Managerial Economics: A Problem Solving Approach
Economics
ISBN:9781337106665
Author:Luke M. Froeb, Brian T. McCann, Michael R. Ward, Mike Shor
Publisher:Cengage Learning
Managerial Economics & Business Strategy (Mcgraw-...
Economics
ISBN:9781259290619
Author:Michael Baye, Jeff Prince
Publisher:McGraw-Hill Education