MATLAB: An Introduction with Applications
6th Edition
ISBN: 9781119256830
Author: Amos Gilat
Publisher: John Wiley & Sons Inc
expand_more
expand_more
format_list_bulleted
Question
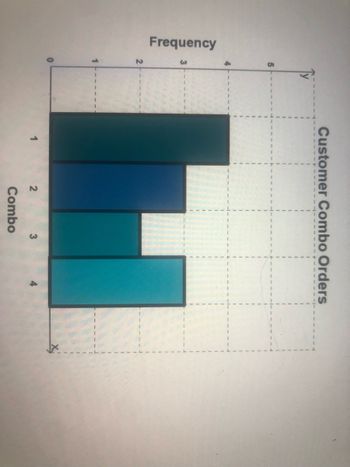
Determine the mean , median , mode and deviation of the data. Pls and ty :)

Transcribed Image Text:Frequency
5
2
Customer Combo Orders
2
Combo
3
Expert Solution
This question has been solved!
Explore an expertly crafted, step-by-step solution for a thorough understanding of key concepts.
Step by stepSolved in 3 steps with 1 images

Knowledge Booster
Similar questions
- The table shows how many siblings a sample of people had.Number of Siblings Frequencya) Determine the mean, median, and mode number of siblings. b) Which measure best represents the number of siblings? Explain. # of siblings Frequency 0 6 1 5 2 3 3 1 4 0 5 2arrow_forwardFind the mode, median, mean, lower quartile, upper quartile, interquartile range,and draw a box and whisker plota. 87,78, 84, 67, 87, 73, 91, 89b.62 72 64 69 70 74 73 70 71 75 77arrow_forwardFind the mean, median, and mode(s) of the data. Do not round. 48, 12, 11, 45, 48, 48, 43, 32arrow_forward
- = The data show the distance (in miles) from an airport of a sample of 22 inbound and outbound airplanes. Use technology to answer parts (a) and (b). a. Find the data set's first, second, and third quartiles. b. Draw a box-and-whisker plot that represents the data set. D 3.2 2.6 3.3 5.9 5.4 3.5 2.6 2.2 5.7 2.9 2.8 2.7 4.3 2.1 1.9 4.6 2.6 5.4 3.6 2.4 5.5 2.2 a. Find the three quartiles. Q₁ Q₂ d (Type integers or decimals. Do not round.) b. Choose the correct box-and-whisker plot below.arrow_forwardB. Directions: For each of the following, calculate the mean, median and mode. Show your solution. (Ungrouped data) 1. 7, 8, 9, 5, 8, 7, 7, 9, 8, 6 2. 100, 120, 132, 122, 145, 121, 105, 109, 3. 115, 119, 114, 112, 112, 109, 104, 106arrow_forward8. Construct a box plot for the following data by finding the min, Q1, median, Q3, the max, and the IQR. 59, 50, 65, 68, 72, 80, 82arrow_forward
- Find the median for the following group of data items. 35, 32, 31, 30, 36, 33, 29, 31 The median is 31.5 (Type an integer or a decimal.) Carrow_forwardFind the mean, median, and mode(s) of the data in the following stem-and-leaf plot. The leaf represents the ones digit. 136 2 1125 36arrow_forwardUse the following table to answer Questions 11 – 14. The numbers represent the points scored in 20 high school basketball games. 25 33 33 43 44 49 50 53 54 54 54 54 57 58 62 63 63 65 66 69 11. Construct a frequency distribution table of the data. Use class width of 10 and start first class with 20.arrow_forward
- Find the mean, the median, and the mode(s), if any, for the given data. Round noninteger means to the nearest tenth. separated list. If an answer does not exist, enter DNE.) 48, 35, 8, 5, 11, 24, 27, 42 mean median mode(s)arrow_forwardSolve c through harrow_forwardThe median for the set of sample measurement { -10,-8,-4,-2,0,6,11} a. -2 b. -1 c. 0 d. 6arrow_forward
arrow_back_ios
SEE MORE QUESTIONS
arrow_forward_ios
Recommended textbooks for you
 MATLAB: An Introduction with ApplicationsStatisticsISBN:9781119256830Author:Amos GilatPublisher:John Wiley & Sons Inc
 Probability and Statistics for Engineering and th...StatisticsISBN:9781305251809Author:Jay L. DevorePublisher:Cengage Learning
 Statistics for The Behavioral Sciences (MindTap C...StatisticsISBN:9781305504912Author:Frederick J Gravetter, Larry B. WallnauPublisher:Cengage Learning
 Elementary Statistics: Picturing the World (7th E...StatisticsISBN:9780134683416Author:Ron Larson, Betsy FarberPublisher:PEARSON
 The Basic Practice of StatisticsStatisticsISBN:9781319042578Author:David S. Moore, William I. Notz, Michael A. FlignerPublisher:W. H. Freeman
 Introduction to the Practice of StatisticsStatisticsISBN:9781319013387Author:David S. Moore, George P. McCabe, Bruce A. CraigPublisher:W. H. Freeman

MATLAB: An Introduction with Applications
Statistics
ISBN:9781119256830
Author:Amos Gilat
Publisher:John Wiley & Sons Inc

Probability and Statistics for Engineering and th...
Statistics
ISBN:9781305251809
Author:Jay L. Devore
Publisher:Cengage Learning

Statistics for The Behavioral Sciences (MindTap C...
Statistics
ISBN:9781305504912
Author:Frederick J Gravetter, Larry B. Wallnau
Publisher:Cengage Learning

Elementary Statistics: Picturing the World (7th E...
Statistics
ISBN:9780134683416
Author:Ron Larson, Betsy Farber
Publisher:PEARSON

The Basic Practice of Statistics
Statistics
ISBN:9781319042578
Author:David S. Moore, William I. Notz, Michael A. Fligner
Publisher:W. H. Freeman

Introduction to the Practice of Statistics
Statistics
ISBN:9781319013387
Author:David S. Moore, George P. McCabe, Bruce A. Craig
Publisher:W. H. Freeman