
MATLAB: An Introduction with Applications
6th Edition
ISBN: 9781119256830
Author: Amos Gilat
Publisher: John Wiley & Sons Inc
expand_more
expand_more
format_list_bulleted
Related questions
Concept explainers
Question
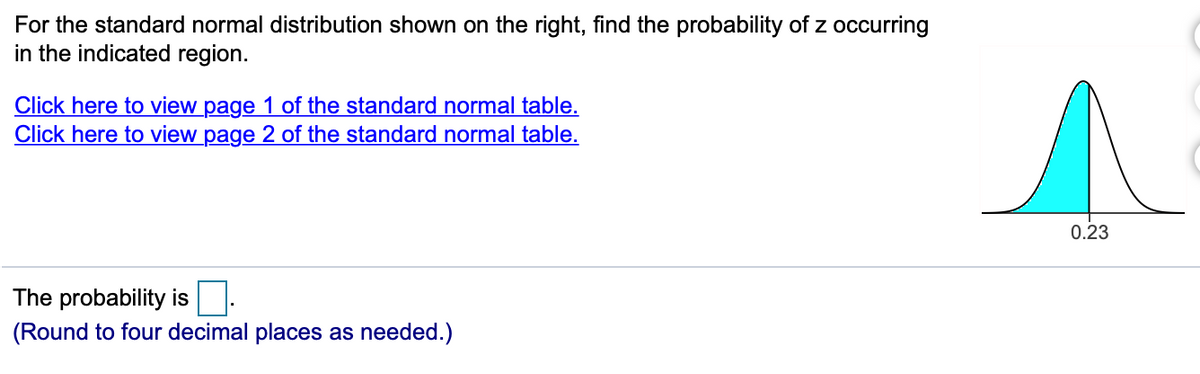

Transcribed Image Text:For the standard normal distribution shown on the right, find the probability of z occurring
in the indicated region.
Click here to view page 1 of the standard normal table.
Click here to view page 2 of the standard normal table.
0.23
The probability is.
(Round to four decimal places as needed.)
Expert Solution
This question has been solved!
Explore an expertly crafted, step-by-step solution for a thorough understanding of key concepts.

This is a popular solution

Trending nowThis is a popular solution!

Step by stepSolved in 2 steps

Knowledge Booster


Learn more about
Need a deep-dive on the concept behind this application? Look no further. Learn more about this topic, statistics and related others by exploring similar questions and additional content below.Similar questions
- Find the z value that corresponds to the given area in the figure below. Use The Standard Normal Distribution Table and enter the answer to 2 decimal places. (Note: Figure not drawn to scale.) + 0.9664 z =arrow_forwardUse the standard normal distribution table to determine the percent of data between z= 1.06 and z= 1.53. Click here to view page 1 of the standard normal distribution table. Click here to view page 2 of the standard normal distribution table. O ..... The percent of data between z = 1.06 and z = 1.53 is (Round to two decimal places as needed.) %. %3D in ms Clear all Check answer Get more help- here to searcharrow_forwardFor the standard normal distribution shown on the right, find the probability of z occurring in the indicated region... Click here to view page 1 of the standard normal table. Click here to view page 2 of the standard normal table. ... The probability is. (Round to four decimal places as needed.) s -0.89arrow_forward
- Find the indicated z score. The graph depicts the standard normal distribution with mean 0 and standard deviation 1. Click to view page 1 of the table. Click to view page 2 of the table. 0.9599 The indicated z score is (Round to two decimal places as needed.)arrow_forwardFind the area of the shaded region. The graph depicts the standard normal distribution with mean 0 and standard deviation 1. Click to view page 1 of the table. Click to view page 2 of the table. The area of the shaded region is (Round to four decimal places as needed.) CECCO A 0.74arrow_forwardUse the standard normal table to find the z-score that corresponds to the given percentile. If the area is not in the table, use the entry closest to the area. If the area is halfway between two entries, use the z-score halfway between the corresponding z-scores. If convenient, use technology to find the z-score. P65arrow_forward
- Determine whether the following statement is true or not. For two normal distributions, N( -3, 2.8) and N( 0.4, 2.8), they have the same shape but different center locations. True Falsearrow_forwardFind the area of the shaded region. The graph depicts the standard normal distribution with mean 0 and standard deviation 1. Click to view page 1 of the table. LOADING... Click to view page 2 of the table. LOADING... z=0.95 A normal curve is over a horizontal axis. A vertical line segment labeled z = 0.95 extends from the horizontal axis to the curve at 0.95. The area under the curve and to the left of the vertical line segment is shaded. The area of the shaded region is enter your response here. (Round to four decimal places as needed.) tabel 2 z .00 .01 .02 .03 .04 .05 .06 .07 .08 .09 z0.0 0.5000 0.5040 0.5080 0.5120 0.5160 0.5199 0.5239 0.5279 0.5319 0.5359 0.00.1 0.5398 0.5438 0.5478 0.5517 0.5557 0.5596 0.5636 0.5675 0.5714 0.5753 0.10.2 0.5793 0.5832 0.5871 0.5910 0.5948 0.5987 0.6026 0.6064…arrow_forwardFor the standard normal distribution shown on the right, find the probability of z occurring in the indicated region. Click here to view page 1 of the standard normal table. Click here to view page 2 of the standard normal table. -2.13 The probability is (Round to four decimal places as needed.)arrow_forward
arrow_back_ios
arrow_forward_ios
Recommended textbooks for you
- MATLAB: An Introduction with ApplicationsStatisticsISBN:9781119256830Author:Amos GilatPublisher:John Wiley & Sons Inc
 Probability and Statistics for Engineering and th...StatisticsISBN:9781305251809Author:Jay L. DevorePublisher:Cengage Learning
 Statistics for The Behavioral Sciences (MindTap C...StatisticsISBN:9781305504912Author:Frederick J Gravetter, Larry B. WallnauPublisher:Cengage Learning
  Elementary Statistics: Picturing the World (7th E...StatisticsISBN:9780134683416Author:Ron Larson, Betsy FarberPublisher:PEARSON
 The Basic Practice of StatisticsStatisticsISBN:9781319042578Author:David S. Moore, William I. Notz, Michael A. FlignerPublisher:W. H. Freeman
 Introduction to the Practice of StatisticsStatisticsISBN:9781319013387Author:David S. Moore, George P. McCabe, Bruce A. CraigPublisher:W. H. Freeman
MATLAB: An Introduction with Applications
Statistics
ISBN:9781119256830
Author:Amos Gilat
Publisher:John Wiley & Sons Inc
Probability and Statistics for Engineering and th...
Statistics
ISBN:9781305251809
Author:Jay L. Devore
Publisher:Cengage Learning
Statistics for The Behavioral Sciences (MindTap C...
Statistics
ISBN:9781305504912
Author:Frederick J Gravetter, Larry B. Wallnau
Publisher:Cengage Learning
Elementary Statistics: Picturing the World (7th E...
Statistics
ISBN:9780134683416
Author:Ron Larson, Betsy Farber
Publisher:PEARSON
The Basic Practice of Statistics
Statistics
ISBN:9781319042578
Author:David S. Moore, William I. Notz, Michael A. Fligner
Publisher:W. H. Freeman
Introduction to the Practice of Statistics
Statistics
ISBN:9781319013387
Author:David S. Moore, George P. McCabe, Bruce A. Craig
Publisher:W. H. Freeman