MATLAB: An Introduction with Applications
6th Edition
ISBN: 9781119256830
Author: Amos Gilat
Publisher: John Wiley & Sons Inc
expand_more
expand_more
format_list_bulleted
Question

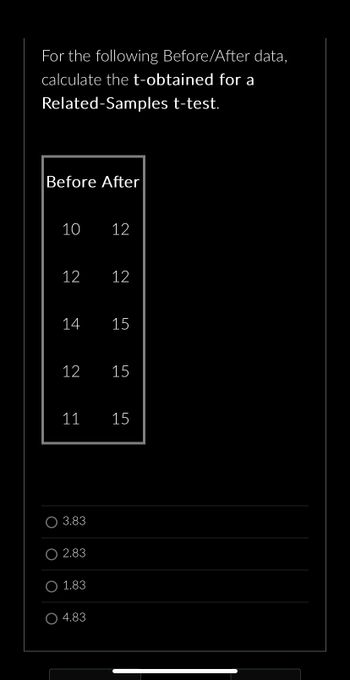
Transcribed Image Text:For the following Before/After data,
calculate the t-obtained for a
Related-Samples t-test.
Before After
10
12
14
12
11
O 3.83
O2.83
1.83
O4.83
12
12
15
15
15
Expert Solution
This question has been solved!
Explore an expertly crafted, step-by-step solution for a thorough understanding of key concepts.
Step by stepSolved in 4 steps

Knowledge Booster
Similar questions
- The number of calories in a 12-oz serving of randomly selected regular and lite beers is recorded and the summarized statistics is below. Is there sufficient evidence to conclude that the mean number of calories for lite beers is the same as that for the regular beers? Use alpha of .1. Assume the variables are approximately normally distributed. Variable N Mean StDev regular 25 140.08 19.56 lite 23 122.90 18.19arrow_forwardWhich of the following samples will have the smallest value for the estimated standard error? Group of answer choices n = 16 with s2 = 64 n = 4 with s2 = 64 n = 4 with s2 = 16 n = 16 with s2 = 16arrow_forward2.18 2.42 2.57 2.89 Suppose the data represent the inches of rainfall in April for a certain city over the course of 20 years. 4.79 D 0.53 0.76 1.23 1.37 1.86 3.37 3.66 3.88 4.09 4.49 5.04 5.36 5.79 Given the quartiles Q, = 2.020, Q, = 3.280, and Q3 = 4.640, compute the interquartile range, IQR. 3.19 6.08 IQR =D (Round to three decimal places as needed.)arrow_forward
- Nonearrow_forwardQ.28 onlyarrow_forward3.2.41 Question Heip пер The blood platelet counts of a group of women have a bell-shaped distribution with a mean of 249.5 and a standard deviation of 60.1. (All units are 1000 cells/µL.) Using the empirical rule, find each approximate percentage below. a. What is the approximate percentage of women with platelet counts within 1 standard deviation of the mean, or between 189.4 and 309.6? r.jp b. What is the approximate percentage of women with platelet counts between 69.2 and 429.8? a. Approximately % of women in this group have platelet counts within 1 standard deviation of the mean, or between 189.4 and 309.6. IMG 65 (Type an integer or a decimal. Do not round.) et Project w....pptx Chock Answer.arrow_forward
- To test whether the mean time needed to mix a batch of material is the same for machines produced by three manufacturers, the Jacobs Chemical Company obtained the following data on the time (in minutes) needed to mix the material. Manufacturer 1 2 3 17 28 24 23 26 23 21 31 27 19 27 26 a. Use these data to test whether the population mean times for mixing a batch of material differ for the three manufacturers. Use x=0.05.Compute the values below (to 2 decimals, if necessary). Sum of Squares, Treatment Sum of Squares, Error Mean Squares, Treatment Mean Squares, Error Calculate the value of the test statistic (to 2 decimals). The p-value is What is your conclusion? b. At the x=0.05 level of significance, use Fisher's LSD procedure to test for the equality of the means for manufacturers 1 and 3. Calculate Fisher's LSD Value (to 2 decimals). What conclusion can you draw after carrying out this test?arrow_forward(10%) The following medians were obtained from random samples 11 10 13 9. 7 13 11 12 8 10 9 9. 15 7 14 16 7 12 10 12 8 9 15 10 12 6. 7 Do the data support the belief that the median is less than 10? Use a = .05arrow_forwardTwo samples of n = 5 participants each generate the following data. Calculate a t-test score for the difference of these two groups. Group 1 Group 2 2 3 3 3 2 2 2 2 1 2 t(8) = 2.86 t(8) = 2.29 t(8) = 2.5 t(8) = 1.11arrow_forward
arrow_back_ios
arrow_forward_ios
Recommended textbooks for you
 MATLAB: An Introduction with ApplicationsStatisticsISBN:9781119256830Author:Amos GilatPublisher:John Wiley & Sons Inc
 Probability and Statistics for Engineering and th...StatisticsISBN:9781305251809Author:Jay L. DevorePublisher:Cengage Learning
 Statistics for The Behavioral Sciences (MindTap C...StatisticsISBN:9781305504912Author:Frederick J Gravetter, Larry B. WallnauPublisher:Cengage Learning
 Elementary Statistics: Picturing the World (7th E...StatisticsISBN:9780134683416Author:Ron Larson, Betsy FarberPublisher:PEARSON
 The Basic Practice of StatisticsStatisticsISBN:9781319042578Author:David S. Moore, William I. Notz, Michael A. FlignerPublisher:W. H. Freeman
 Introduction to the Practice of StatisticsStatisticsISBN:9781319013387Author:David S. Moore, George P. McCabe, Bruce A. CraigPublisher:W. H. Freeman

MATLAB: An Introduction with Applications
Statistics
ISBN:9781119256830
Author:Amos Gilat
Publisher:John Wiley & Sons Inc

Probability and Statistics for Engineering and th...
Statistics
ISBN:9781305251809
Author:Jay L. Devore
Publisher:Cengage Learning

Statistics for The Behavioral Sciences (MindTap C...
Statistics
ISBN:9781305504912
Author:Frederick J Gravetter, Larry B. Wallnau
Publisher:Cengage Learning

Elementary Statistics: Picturing the World (7th E...
Statistics
ISBN:9780134683416
Author:Ron Larson, Betsy Farber
Publisher:PEARSON

The Basic Practice of Statistics
Statistics
ISBN:9781319042578
Author:David S. Moore, William I. Notz, Michael A. Fligner
Publisher:W. H. Freeman

Introduction to the Practice of Statistics
Statistics
ISBN:9781319013387
Author:David S. Moore, George P. McCabe, Bruce A. Craig
Publisher:W. H. Freeman