
MATLAB: An Introduction with Applications
6th Edition
ISBN: 9781119256830
Author: Amos Gilat
Publisher: John Wiley & Sons Inc
expand_more
expand_more
format_list_bulleted
Related questions
Concept explainers
Question
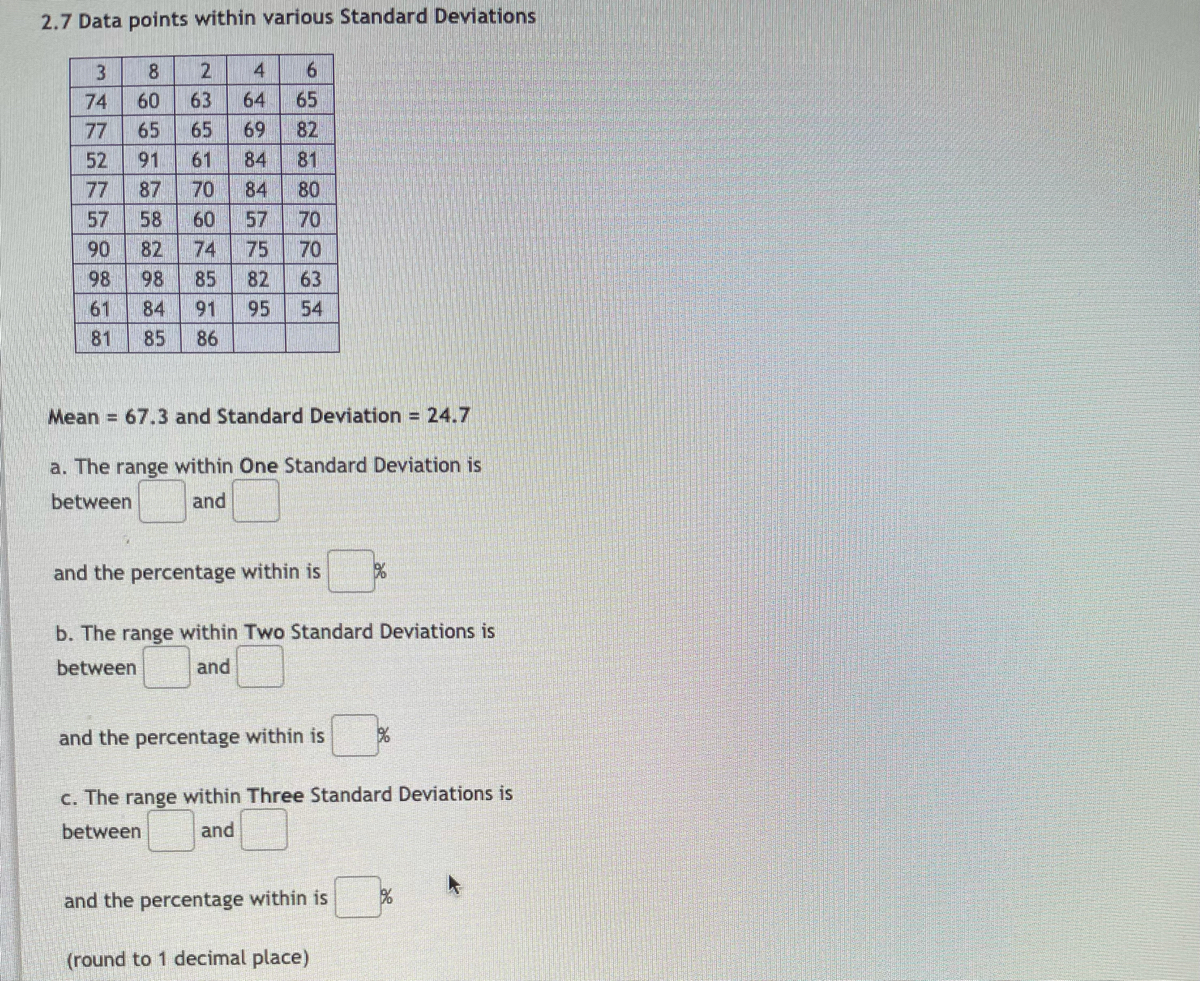

Transcribed Image Text:2.7 Data points within various Standard Deviations
3
8
4.
6
74
60
63
64
65
77
65
65
69
82
52
91
61
84
81
77
87
70
84
80
58
60
57
70
90
82
74
75
70
98
98
85
82
63
61
84
91
95
54
81
85
86
Mean = 67.3 and Standard Deviation = 24.7
a. The range within One Standard Deviation is
between
and
and the percentage within is
b. The range within Two Standard Deviations is
between
and
and the percentage within is
c. The range within Three Standard Deviations is
between
and
and the percentage within is
(round to 1 decimal place)
2.
in
Expert Solution
This question has been solved!
Explore an expertly crafted, step-by-step solution for a thorough understanding of key concepts.

Step by stepSolved in 4 steps

Knowledge Booster


Learn more about
Need a deep-dive on the concept behind this application? Look no further. Learn more about this topic, statistics and related others by exploring similar questions and additional content below.Similar questions
- For the variable AGE, calculate the standard deviation. Respondent Marital Status Age Attitude on Abortion (high score= strong opposition) A Single 18 10 B Single 20 9 C Widowed 21 8 D Married 30 10 E married 25 7 F Married 26 7 G Divorced 19 9 H Widowed 29 6 I Divorced 31 10 J Married 55 5 K Widowed 32 4 L Married 28 3 M Divorced 23 2 N Married 24 1 O Divorced 32 9arrow_forwardCalculate the mean and standard deviation for the two variables separately.arrow_forwardData set: 139 173 198 214 175 193 166 220 122 177 119 203 175 147 250 205 216 214 260 216 256 208 185 150 204 216 261 320 236 229 138 177 132 191 356 236 316 246 212 305 289 144 396 296 171 230 324 232 46 188 164 204 109 87 218 89 199 143 265 237 Find frequency and relative frequency draw relative frequency Use the empirical rule to estimate the percentages of observations that lie within one, two, and three standard deviations to either side of the Use the data to obtain the exact percentages of observations that lie within one, two, and three standard deviations to either side of the Compare your answers in parts (b) and (c)arrow_forward
arrow_back_ios
arrow_forward_ios
Recommended textbooks for you
- MATLAB: An Introduction with ApplicationsStatisticsISBN:9781119256830Author:Amos GilatPublisher:John Wiley & Sons Inc
 Probability and Statistics for Engineering and th...StatisticsISBN:9781305251809Author:Jay L. DevorePublisher:Cengage Learning
 Statistics for The Behavioral Sciences (MindTap C...StatisticsISBN:9781305504912Author:Frederick J Gravetter, Larry B. WallnauPublisher:Cengage Learning
  Elementary Statistics: Picturing the World (7th E...StatisticsISBN:9780134683416Author:Ron Larson, Betsy FarberPublisher:PEARSON
 The Basic Practice of StatisticsStatisticsISBN:9781319042578Author:David S. Moore, William I. Notz, Michael A. FlignerPublisher:W. H. Freeman
 Introduction to the Practice of StatisticsStatisticsISBN:9781319013387Author:David S. Moore, George P. McCabe, Bruce A. CraigPublisher:W. H. Freeman
MATLAB: An Introduction with Applications
Statistics
ISBN:9781119256830
Author:Amos Gilat
Publisher:John Wiley & Sons Inc
Probability and Statistics for Engineering and th...
Statistics
ISBN:9781305251809
Author:Jay L. Devore
Publisher:Cengage Learning
Statistics for The Behavioral Sciences (MindTap C...
Statistics
ISBN:9781305504912
Author:Frederick J Gravetter, Larry B. Wallnau
Publisher:Cengage Learning
Elementary Statistics: Picturing the World (7th E...
Statistics
ISBN:9780134683416
Author:Ron Larson, Betsy Farber
Publisher:PEARSON
The Basic Practice of Statistics
Statistics
ISBN:9781319042578
Author:David S. Moore, William I. Notz, Michael A. Fligner
Publisher:W. H. Freeman
Introduction to the Practice of Statistics
Statistics
ISBN:9781319013387
Author:David S. Moore, George P. McCabe, Bruce A. Craig
Publisher:W. H. Freeman