
Related questions
For nos. 17 to 21.
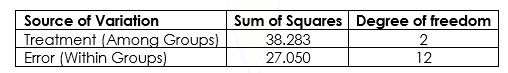
It is suspected that higher priced automobiles are assembled with greater care than lower priced automobiles. To investigate whether there is any basis for this idea, a large luxury model A, a medium size sedan B, and a subcompact hatchback C were compared for defects when they arrived at the dealer's showroom. All cares were manufactured by the same company. The results of the computations are provided in the summary of ANOVA table below.
17. What is the total sum of squares of the problem.
A. 7.987
B. 11.233
C. 45.876
D. 65.333
18. Compute for the
A. 20.425
B. 19.142
C. 2.178
D. 0.052
19. What is the mean square of the error?
A. 2.254
B. 1.444
C. 0.444
D. 0.254
20. What is the computed value of the test statistic, F_comp?
A. 8.49
B. 16.888
C. 21.396
D. 0.118
21. The null hypothesis will be rejected if F_comp is greater than what value? Use α=.01.
A. 3.89
B. 19.41
C. 6.93
D. 99.42


Step by stepSolved in 4 steps


- a. Given the following information obtained from three normally distributed populations, construct an ANOVA table. (Round intermediate calculations to at least 4 decimal places. Round "SS" to 2 decimal places, "MS" to 4 decimal places, and "P" to 3 decimal places.) SSTR = 186.2; SSE = 2,387.2; c = 3; n = n2 = n3 = 10 ANOVA Source of Variation SS df MS p-value Between Groups 0.363 Within Groups Total b. At the 1% significance level, what is the conclusion to the ANOVA test of mean differences? O Do not reject Ha. we cannot conclude that some means differ. O Reject Ho: we can conclude that some means differ. O Do not reject Ha: we can conclude that some means differ. O Reject Ha, we cannot conclude that some means differ.arrow_forward1. in one-way ANOVA, identify the statistic used as a measure of variation among the sample means. as a measure of variation within the samples. to compare the variation among the sample means to the variation within the samples. 2. What is a two-way ANOVA?arrow_forward7. please help a through d.arrow_forward
- 1. A car dealer wants to determine whether there is a difference in gas mileage between six car models. The ANOVA table for the data is given below. [Seorang pengusaha kereta ingin menentukan sama ada terdapat perbezaan perbatuan gas di antara 3 model kereta. Jadual ANOVA bagi data berkenaan seperti di bawah.] Source [Sumber] [Darjah kebebasan] [Jumlah kuasa dua] [Min kuasa dua] Treatment Degress of freedom Sum of squares Mean square F a 74 d f |[Rawatan] Error [Ralat] Total 35 195 Jumlah] (a) Complete the ANOVA table. [Lengkapkan jadual ANOVA tersebut.] (b) Write the hypotheses and determine whether there is a significant difference between mean gas mileage by different car models at a = 0.05. [Tulis hipotesis dan tentukan sama ada terdapat perbezaan yang signifikan antara perbatuan purata gas oleh model kereta yang berbeza pada a = 0.05.] %3Darrow_forwardA researcher computes the following one-way within-subjects ANOVA table. Fill in the blanks for the appropriate cells in the table below. Source of Variation SS df MS FObt Between groups 10 Between persons 60 9 Within groups (error) 9 6 Total 124 19arrow_forwardA sociologist is interested in the opinion of Minnesota teachers on the recent labor union law passed by Wisconsin lawmakers. a. What is the experimental unit? b.What is the population? c.What are the variables relevant to this study? Classify them as continuous, discrete, nominal, or ordinal. d. Explain how you would select a sample for this study. Explain pros and cons of your method.arrow_forward
- Consider the population of car drivers in the United States, and how many traffic tickets they've each received over the course of their lives. Would the distribution of these traffic tickets be left-skewed (where we often see mean median)? Pick ONE option Left-skewed Right-skewed It would be unreasonable to guess Potentially both at oncearrow_forwardA union leader claims that absences on the different days of the week are equally likely. To test this claim, a company manager collects the data shown below. Use a 0.05 significance level to test the claim. Day Mon Tue Wed Thur Fri Absences 40 15 12 23 43 a. Before doing any calculations, do the data appear to support the union leader's claim? Why or why not? A. No, absences on The and Wed are much larger than on other days B. Yes, there are roughly the same number of absences on the different days of the week C. Yes, more absences on Mon and Fri are normal D. No, absences on Mon and Fri are much larger than on other days b. State Upper H 0 . A. At least one proportion is different than claimed B. p Subscript Mon Baseline equals 1 divided by 4 comma p Subscript Tue Baseline equals 1 divided by 4 comma p…arrow_forward] 1 5. A storeowner wishes to compare the average amount of money high school and college students spend on music downloads. He randomly selects 10 students from each of three different student populations: high school, undergraduate, and graduate. The statistical assumptions required to perform a one-way ANOVA to compare the means of these three groups are reasonable based on the data. A partially completed ANOVA table is provided below. Source Sum of Squares DF Mean Square F dfl I F df2 Groups Error Total SSG 3240 4450 (a) Calculate all incomplete parts in the table. MSG MSE (b) What is the value of the pooled standard deviation (estimate for σ)?arrow_forward
- 18. The governor of New York has banned selling or purchasing "large" soft drinks, where a "large" is defined as being more than 16 oz. Sonic, famous for its Route 44 drinks is interested in estimating the proportion of New Yorkers that favor this ban. From a random survey of 800 New Yorkers, 375 answered no to the question, “Do you favor the governor's ban on 'large' soft drinks?" a. Find a 97.5% confidence interval for the proportion of New Yorkers who favor the ban on "large" soft drinks. b. Interpret the confidence interval. c. Can you conclude with 97.5% confidence that a majority of New Yorkers favor the ban on "large" soft drinks? Why or why not. d. Without doing any other calculations, can you be 99% confident that a majority of New Yorkers favor the ban on “large" soft drinks?arrow_forward1. An education researcher is comparing four different algebra curricula. Eighth grade students are randomly assigned to one of the four groups with each group consisting of 20 students. Their state achievement test scores are compared at the end of the year. a. In this context, construct the ANOVA model. b. Use the info above to finish the ANOVA table. Source df SS MS F Between Groups 829 Within Groups 47511.38 Totalarrow_forward
- MATLAB: An Introduction with ApplicationsStatisticsISBN:9781119256830Author:Amos GilatPublisher:John Wiley & Sons Inc
 Probability and Statistics for Engineering and th...StatisticsISBN:9781305251809Author:Jay L. DevorePublisher:Cengage Learning
 Statistics for The Behavioral Sciences (MindTap C...StatisticsISBN:9781305504912Author:Frederick J Gravetter, Larry B. WallnauPublisher:Cengage Learning
  Elementary Statistics: Picturing the World (7th E...StatisticsISBN:9780134683416Author:Ron Larson, Betsy FarberPublisher:PEARSON
 The Basic Practice of StatisticsStatisticsISBN:9781319042578Author:David S. Moore, William I. Notz, Michael A. FlignerPublisher:W. H. Freeman
 Introduction to the Practice of StatisticsStatisticsISBN:9781319013387Author:David S. Moore, George P. McCabe, Bruce A. CraigPublisher:W. H. Freeman