
Related questions
Concept explainers
For all students who have taken a certain class during the last ten years, the
average on the mid-term is 83.4 and the standard deviation of the mid-term
scores is 7.2; the average on the final is 79.3 and the standard deviation of the
scores on the final is 5.1; the
scores on the final is 0.86.
4. My teacher has lost our mid-term scores (but at least has our scores on
the final), so she is fitting a straight line to guess what we probably got on
the mid-term. What’s the equation of the line she is using?
5. I got a 90 on the final. What does my teacher think I got on the midterm?
Introduction:
Consider that x is the independent variable and y is the dependent variable. The size of the observations is n.
The formula for sample least-squares regression line is:
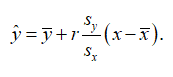
Here, x̄, y̅ are the respective sample means of x and y, sx, sy are the respective sample standard deviations of x and y, and r is the sample correlation coefficient.

Trending nowThis is a popular solution!

Step by stepSolved in 3 steps with 3 images


- Test scores for a history class had a mean of 69 with a standard deviation of 4.5. Test scores for a physics class had a mean of 79 with a standard deviation of 3.5. Suppose a student gets a 75 on the history test and 83 on the physics test. Calculate the z- score for each test. On which test did the student perform better? A. B. C. D. History exam; history z-score is 1.33; physics z-score is 1.14 Physics exam; history z-score is 1.33; physics z-score is 1.14 History exam; history z-score is -1.33; physics z-score is -1.14 Physics exam; history z-score is -1.33; physics z-score is -1.14arrow_forwardThe following information is slightly different for each student but very close to the actual real data. Assume the number of years in prison before being exonerated is normally distributed for both white and black males. The average amount of time Black males are in prison before being exonerated is 13.7 years with a population standard deviation of 9.8 years. The average amount of time White male are in prison before being exonerated is 9.2 years with a population standard deviation of 8.6. Give all answers to at least 2 decimal places.a) If a Black male is at the 70th percentile for years in prison before being exonerated, find the time the person has been in prison. yearsarrow_forwardThere are two major tests of readiness for college, the ACT and the SAT. ACT scores are reported on a scale from 1 to 36. The distribution of ACT scores is approximately Normal, with mean of 21.9 and standard deviation of 5.8. SAT scores are reported on a scale from 400 to 1600. The distribution of SAT scores is approximately Normal, with mean of 1,059 and standard deviation of 203. What ACT scores make up the top 10% of all the scores? Round to the nearest whole number.arrow_forward
- Use z scores to compare the given values. The tallest living man at one time had a height of 225 cm. The shortest living man at that time had a height of 104.3 cm. Heights of men at that time had a mean of 173.55 cm and a standard deviation of 5.15 cm. Which of these two men had the height that was more extreme? Since the z score for the tallest man is z= and the z score for the shortest man is z= the V man had the height that was more extreme. (Round to two decimal places.)arrow_forwardSuppose that Jett achieves a score of 1250 on the SAT, and his sister Kate scores 29 on the ACT. The SAT scores are normally distributed with a mean of 1100 and standard deviation of 250. The ACT scores are normally distributed with a mean of about 20 and standard deviation of 5. Who did better, relative to their peers?arrow_forwardUse z scores to compare the given values. The tallest living man at one time had a height of 238 cm. The shortest living man at that time had a height of 142.4 cm. Heights of men at that time had a mean of 175.45 cm and a standard deviation of 5.59 cm. Which of these two men had the height that was more extreme? ... Since the z score for the tallest man is z = 0 and the z score for the shortest man is z = the man had the height that was Im- more extreme. (Round to two decimal places.) shortest tallestarrow_forward
- A sample of 134 motels is selected from a large urban area and the price for a night of lodging for a single room was determined for each motel. The mean rate is computed to be $87 and the standard deviation is $14. One motel charged $57 per night which is the 13th percentile. Another motel charged $118 per night which is the 75th percentile. Step 3 of 4 : One of the motels was 1.3 standard deviations below the mean, what is the price of a single room at the motel? Round your answer to two decimal places.arrow_forwardOne year the ACT had a mean score of 22.7 and a standard deviation of 4.1. minutes. (a)Calculate the z-score of an ACT score of 25. Interpret it using a complete sentence. B. What ACT score is 1.5 standard deviations above the mean? What can you say about this consumptionarrow_forwardIn Professor Krugman’s economics course, the correlation between the students’ total scores prior to the final examination and their final‑examination scores is ?=0.5.r=0.5. The pre‑exam totals for all students in the course have mean 280280 and standard deviation 40.40. The final‑exam scores have mean 7575 and standard deviation 8.8. Professor Krugman has lost Julie’s final exam but knows that her total before the exam was 300.300. He decides to predict her final‑exam score from her pre‑exam total. (a) Which of the choices is the least‑squares regression line of final‑exam scores on pre‑exam total scores in this course?arrow_forward
- When the correlation between x and y is –1.0, what will the standard deviation of errors be? Why is this?arrow_forwardSuppose the scores of students on a Statistics course are Normally distributed with a mean of 400 and a standard deviation of 42. What percentage of the students scored between 316 and 400 on the exam? (Give your answer to 3 significant figures.) percent.arrow_forwardThere are two major tests of readiness for college, the ACT and the SAT. ACT scores are reported on a scale from 1 to 36. The distribution of ACT scores is approximately Normal with mean = 21.5 and standard deviation = 5.4. SAT Scores are reported on a scale from 600 to 2400. The distribution of SAT scores is approximately Normal with mean = 1498 and standard deviation = 316. (b) Joshua scores 17 on the ACT. Anthony scores 1030 on the SAT. Assuming both tests measure the same thing, who has the higher score? Report both z-scores. (c) What is the purpose of finding the z-scores for both the ACT and SAT scores?arrow_forward
- MATLAB: An Introduction with ApplicationsStatisticsISBN:9781119256830Author:Amos GilatPublisher:John Wiley & Sons Inc
 Probability and Statistics for Engineering and th...StatisticsISBN:9781305251809Author:Jay L. DevorePublisher:Cengage Learning
 Statistics for The Behavioral Sciences (MindTap C...StatisticsISBN:9781305504912Author:Frederick J Gravetter, Larry B. WallnauPublisher:Cengage Learning
  Elementary Statistics: Picturing the World (7th E...StatisticsISBN:9780134683416Author:Ron Larson, Betsy FarberPublisher:PEARSON
 The Basic Practice of StatisticsStatisticsISBN:9781319042578Author:David S. Moore, William I. Notz, Michael A. FlignerPublisher:W. H. Freeman
 Introduction to the Practice of StatisticsStatisticsISBN:9781319013387Author:David S. Moore, George P. McCabe, Bruce A. CraigPublisher:W. H. Freeman