MATLAB: An Introduction with Applications
6th Edition
ISBN: 9781119256830
Author: Amos Gilat
Publisher: John Wiley & Sons Inc
expand_more
expand_more
format_list_bulleted
Concept explainers
Question
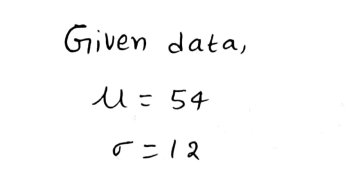
For a
a. Scores greater than 45.
b. Scores less than 60.
c. Scores between 36 and 60.
d. Scores less than 24.
Expert Solution
arrow_forward
Step 1

Step by stepSolved in 5 steps with 5 images

Knowledge Booster
Learn more about
Need a deep-dive on the concept behind this application? Look no further. Learn more about this topic, statistics and related others by exploring similar questions and additional content below.Similar questions
- For a sample with a standard deviation of s = 12, a score of X = 42 corresponds to z = –0.50. The mean for the sample is M = ___. a. 48 b. 45 c. 40 d. 36arrow_forwardFor the following questions: Mean 10 and Standard Deviation of 5. Assume that the population is normally distributed. a. Calculate the z-score for a raw score of 5. What proportion of the distribution is equal to or less than this? b. Calculate the z-score for a raw score of 17. What proportion of the distribution is equal to or greater than this score? c. Determine the probability of obtaining a score that falls between a raw score of 5 and a raw score of 17.arrow_forward4. Which proportion of a normal distribution is located between the mean and z = +1.40? 5. A vertical line drawn through a normal distribution at z = +2.11 separates the distribution into two sections, the body and the tail. Which proportion of the distribution is in the tail?arrow_forward
- The blood pressure in millimeters was measured for a large sample of people. The average pressure is 140 mm, and the SD of the measurements is 20 mm. The histogram looks reasonably like a normal curv Use the normal curve to estimate the following percentages. Choose the answer that is closest to being correct. A 19.1% B 30.9% C 38.2% D 69.1% E 68.27% A The percentage of people with blood pressure between 130 and 150 mm. B The percentage of people with blood pressure between 140 and 150 mm. D The percentage of people with blood pressure over 150 mm.arrow_forwardFor each of the following z-scores, sketch a normal distribution and draw a vertical line at the location of the z-score. Then, determine whether the body is to the right or the left of the z-score and find the proportion of the distribution located in the body. 7.2 z = 0.75 z = -0.67 а. z = -0.33 b. С. z = 1.96 d.arrow_forwardA normal distribution has a population mean of u = 90 and a standard deviation population of o =15. For each of the following scores, indicate whether the tail is to the right or left of the score and find the proportion of the distribution located in the tail. a. X 5 93 b. X 5 110 c. X 5 85 d. X 5arrow_forward
- On an exam with μ = 52, you have a score of X = 56. Which value for the standard deviation would give you the highest position in the class distribution? Select one: a. cannot determine from the information given b. σ = 4 c. σ = 2 d. σ = 8arrow_forwardFor bone density scores that are nomally distributed with a mean of 0 and a standard deviation of 1, find the percentage of scores that are a. significantly high (or at least 2 standard deviations above the mean). b. significantly low (or at least 2 standard deviations below the mean). c. not significant (or less than 2 standard deviations away from the mean). a. The percentage of bone density scores that are significantly high is %. (Round to two decimal places as needed.) b. The percentage of bone density scores that are significantly low is %. (Round to two decimal places as needed.) c. The percentage of bone density scores that are not significant is (Round to two decimal places as needed.) %.arrow_forwardSketch the normal distribution with a. µ = -2 and σ = 2.b. µ = -2 and σ = 1/2.c. µ = 0 and σ = 2.arrow_forward
arrow_back_ios
arrow_forward_ios
Recommended textbooks for you
 MATLAB: An Introduction with ApplicationsStatisticsISBN:9781119256830Author:Amos GilatPublisher:John Wiley & Sons Inc
 Probability and Statistics for Engineering and th...StatisticsISBN:9781305251809Author:Jay L. DevorePublisher:Cengage Learning
 Statistics for The Behavioral Sciences (MindTap C...StatisticsISBN:9781305504912Author:Frederick J Gravetter, Larry B. WallnauPublisher:Cengage Learning
 Elementary Statistics: Picturing the World (7th E...StatisticsISBN:9780134683416Author:Ron Larson, Betsy FarberPublisher:PEARSON
 The Basic Practice of StatisticsStatisticsISBN:9781319042578Author:David S. Moore, William I. Notz, Michael A. FlignerPublisher:W. H. Freeman
 Introduction to the Practice of StatisticsStatisticsISBN:9781319013387Author:David S. Moore, George P. McCabe, Bruce A. CraigPublisher:W. H. Freeman

MATLAB: An Introduction with Applications
Statistics
ISBN:9781119256830
Author:Amos Gilat
Publisher:John Wiley & Sons Inc

Probability and Statistics for Engineering and th...
Statistics
ISBN:9781305251809
Author:Jay L. Devore
Publisher:Cengage Learning

Statistics for The Behavioral Sciences (MindTap C...
Statistics
ISBN:9781305504912
Author:Frederick J Gravetter, Larry B. Wallnau
Publisher:Cengage Learning

Elementary Statistics: Picturing the World (7th E...
Statistics
ISBN:9780134683416
Author:Ron Larson, Betsy Farber
Publisher:PEARSON

The Basic Practice of Statistics
Statistics
ISBN:9781319042578
Author:David S. Moore, William I. Notz, Michael A. Fligner
Publisher:W. H. Freeman

Introduction to the Practice of Statistics
Statistics
ISBN:9781319013387
Author:David S. Moore, George P. McCabe, Bruce A. Craig
Publisher:W. H. Freeman