
MATLAB: An Introduction with Applications
6th Edition
ISBN: 9781119256830
Author: Amos Gilat
Publisher: John Wiley & Sons Inc
expand_more
expand_more
format_list_bulleted
Related questions
Concept explainers
Question
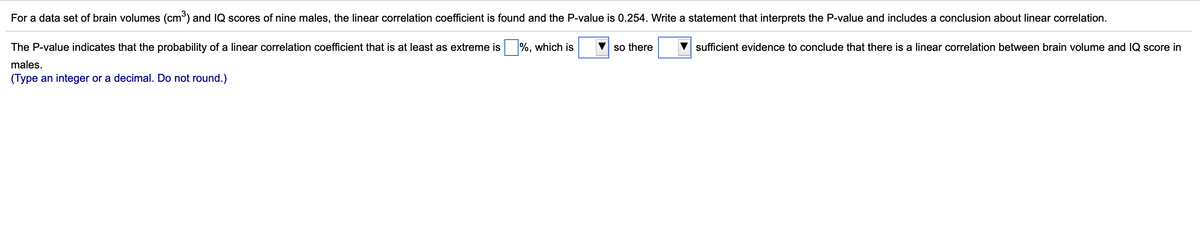

Transcribed Image Text:For a data set of brain volumes (cm) and IQ scores of nine males, the linear correlation coefficient is found and the P-value is 0.254. Write a statement that interprets the P-value and includes a conclusion about linear correlation.
The P-value indicates that the probability of a linear correlation coefficient that is at least as extreme is
%, which is
V so there
sufficient evidence to conclude that there is a linear correlation between brain volume and IQ score in
males.
(Type an integer or a decimal. Do not round.)
Expert Solution
This question has been solved!
Explore an expertly crafted, step-by-step solution for a thorough understanding of key concepts.

This is a popular solution

Trending nowThis is a popular solution!

Step by stepSolved in 2 steps

Knowledge Booster


Learn more about
Need a deep-dive on the concept behind this application? Look no further. Learn more about this topic, statistics and related others by exploring similar questions and additional content below.Similar questions
- The data shown below consists of the price (in dollars) of 7 events at a local venue and the number of people who attended. Determine if there is significant linear correlation between ticket price and number of attendees. Use a significance level of 0.01 and round all values to 4 decimal places. Ticket Price Attendence 6 170 10 151 14 171 18 160 22 172 26 179 30 130 Но: р %3D 0 Ha: p = 0 Find the Linear Correlation Coefficient Find the p-value p-value = The p-value is O Less than (or equal to) a O Greater than aarrow_forwardWhich r is the strongest correlation? O -0.8 O-0.18 O-0.09 O 0.711 O 0.4arrow_forwardA biologist looked at the relationship between number of seeds a plant produces and the percent of those seeds that sprout. The results of the survey are shown below. Seeds Produced 68 56 61 Sprout Percent 60.6 69.2 = 0 48 64.7 64.6 #0 a. Find the correlation coefficient: b. The null and alternative hypotheses for correlation are: H₂: ? H₁: 2 The p-value is: 63 64.1 40 Round to 2 decimal places. 63 62 65.1 68.4 84 (Round to four decimal places) c. Use a level of significance of a = 0.05 to state the conclusion of the hypothesis test in the context of the study. O There is statistically significant evidence to conclude that there is a correlation between the number of seeds that a plant produces and the percent of the seeds that sprout. Thus, the regression line is useful. O There is statistically insignificant evidence to conclude that a plant that produces more seeds will have seeds with a lower sprout rate than a plant that produces fewer seeds. O There is statistically significant…arrow_forward
- Solve the second onearrow_forwardThe data below are the final scores of 10 randomly selected statistics students and the number of hours they studied for the final. What is the best-predicted value for y given x = 6? Assume that the variables x and y have a significant correlation. hours x: 3,5,2,8,2,4,4,5,6,3 scores y: 65,80,60,88,66,78,85,90,90,71 A.84 B.86 C.85 D.87arrow_forwardA food truck owner recorded the temperature at noon, in degrees Fahrenheit, and the number of bowls of soup sold during the lunch hour for a random sample of 5 days. The data are shown in the following table. Temperature (degrees Fahrenheit) 57 75 43 68 67 Number sold 17 12 20 8 13 The mean temperature of the sample is 62 degrees Fahrenheit, and the mean number sold is 14. What is the correlation between the temperature and the number sold? A -0.85 B -0.68 0.68 D 0.73 E 0.85arrow_forward
- fill in the blank pls!arrow_forwardThe data shown below consists of the price (in dollars) of 7 events at a local venue and the number of people who attended. Determine if there is significant negative linear correlation between ticket price and number of attendees. Use a significance level of 0.05 and round all values to 4 decimal places. Ticket Price Attendence 6. 109 10 114 14 139 18 142 22 139 26 132 30 154 Но: = 0 На: р Find the Linear Correlation Coefficient r = Find the p-value p-value = %3D The p-value is Less than (or equal to) a Greater than a The p-value leads to a decision to Reject Ho Аcсept Ho Do Not Reject Ho The conclusion is There is a significant linear correlation between ticket price and attendance. There is a significant negative linear correlation between ticket price and attendance. There is a significant positive linear correlation between ticket price and attendance. There is insufficient evidence to make a conclusion about the linear correlation between ticket price and attendance.arrow_forwardTwo separate tests are designed to measure a student's ability to solve problems. Several students are randomly selected to take both tests and the results are shown below. Test A (x) 43 65 73 34 99 78 65 Test B (y) 39 60 62 20 85 70 54 1. Calculate r, the linear correlation coefficient. Identify the values for each part below. Part a. The value of n Part b. The sum of the x-values Part c. The sum of the y-values Part d. The sum of the x-squared values Part e. The sum of the y-squared values Part f. The sum of the (xy) values Part g. The final value of r rounded top three decimal placesarrow_forward
- A random sample of ten professional athletes produced the following data. The first row is the number of endorsements the athlete has and the second row is the amount of money made (in millions of dollars) by the athlete. What is the linear correlation coefficient? Round to three decimal places. Number of Endorsements 0 3 2 1 5 5 4 3 0 4 Profit (in Millions) 2 8 7 3 13 12 9 9 3 10arrow_forwardurgen pleasearrow_forwardBelow shows the linear relationship between first year college GPA and high school GPA For both variables the GPA ranges from 0 to 4 in this sample. However, for the high schools sampled in this region, the true range of GPA is 0 to 5, how might this affect the correlation between these two variables?arrow_forward
arrow_back_ios
SEE MORE QUESTIONS
arrow_forward_ios
Recommended textbooks for you
- MATLAB: An Introduction with ApplicationsStatisticsISBN:9781119256830Author:Amos GilatPublisher:John Wiley & Sons Inc
 Probability and Statistics for Engineering and th...StatisticsISBN:9781305251809Author:Jay L. DevorePublisher:Cengage Learning
 Statistics for The Behavioral Sciences (MindTap C...StatisticsISBN:9781305504912Author:Frederick J Gravetter, Larry B. WallnauPublisher:Cengage Learning
  Elementary Statistics: Picturing the World (7th E...StatisticsISBN:9780134683416Author:Ron Larson, Betsy FarberPublisher:PEARSON
 The Basic Practice of StatisticsStatisticsISBN:9781319042578Author:David S. Moore, William I. Notz, Michael A. FlignerPublisher:W. H. Freeman
 Introduction to the Practice of StatisticsStatisticsISBN:9781319013387Author:David S. Moore, George P. McCabe, Bruce A. CraigPublisher:W. H. Freeman
MATLAB: An Introduction with Applications
Statistics
ISBN:9781119256830
Author:Amos Gilat
Publisher:John Wiley & Sons Inc
Probability and Statistics for Engineering and th...
Statistics
ISBN:9781305251809
Author:Jay L. Devore
Publisher:Cengage Learning
Statistics for The Behavioral Sciences (MindTap C...
Statistics
ISBN:9781305504912
Author:Frederick J Gravetter, Larry B. Wallnau
Publisher:Cengage Learning
Elementary Statistics: Picturing the World (7th E...
Statistics
ISBN:9780134683416
Author:Ron Larson, Betsy Farber
Publisher:PEARSON
The Basic Practice of Statistics
Statistics
ISBN:9781319042578
Author:David S. Moore, William I. Notz, Michael A. Fligner
Publisher:W. H. Freeman
Introduction to the Practice of Statistics
Statistics
ISBN:9781319013387
Author:David S. Moore, George P. McCabe, Bruce A. Craig
Publisher:W. H. Freeman