MATLAB: An Introduction with Applications
6th Edition
ISBN: 9781119256830
Author: Amos Gilat
Publisher: John Wiley & Sons Inc
expand_more
expand_more
format_list_bulleted
Question
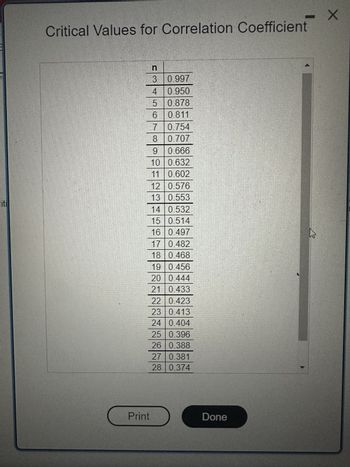
The rest of the critical values for
plug 29 and 30 to the picture I sent for the rest of the table

Transcribed Image Text:iti
Critical Values for Correlation Coefficient
n
3
0.997
4 0.950
5
0.878
6
0.811
7
0.754
8 0.707
9 0.666
10 0.632
11 0.602
12
0.576
13 0.553
Print
14 0.532
15 0.514
16 0.497
17 0.482
18 0.468
19 0.456
20 0.444
21 0.433
22 0.423
23 0.413
24 0.404
25 0.396
26 0.388
27 0.381
28 0.374
Done
X

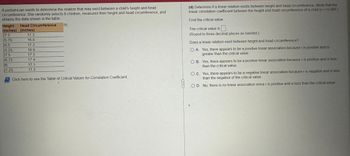
Transcribed Image Text:A pediatrician wants to determine the relation that may exist between a child's height and head
circumference. She randomly selects 8 children, measures their height and head circumference, and
obtains the data shown in the table.
Height Head Circumference
(inches) (inches)
27.5
25.75
26.5
25.25
27.5
26.75
26
27.25
17.3
16.9
17.3
16.9
17.5
17.4
17.1
17.3
Click here to see the Table of Critical Values for Correlation Coefficient.
(d) Determine if a linear relation exists between height and head circumference. (Note that the
linear correlation coefficient between the height and head circumference of a child is r=0.888)
Find the critical value
The critical value is
(Round to three decimal places as needed.)
Does a linear relation exist between height and head circumference?
QA. Yes, there appears to be a positive linear association because ris positive and is
greater than the critical value.
OB. Yes, there appears to be a positive linear association because r is positive and is less
than the critical value.
OC. Yes, there appears to be a negative linear association because ris negative and is less
than the negative of the critical value.
OD. No, there is no linear association since r is positive and is less than the critical value
Expert Solution
This question has been solved!
Explore an expertly crafted, step-by-step solution for a thorough understanding of key concepts.
This is a popular solution
Trending nowThis is a popular solution!
Step by stepSolved in 3 steps with 15 images

Knowledge Booster
Similar questions
- If the correlation between variables A and B is +1.35… A. The relationship is negative. B. The relationship is positive. C. The relationship is positive and very strong. D. We have miscalculated.arrow_forwardIf the coefficient of correlation between x and y is close to 1, this indicates that: OA. y causes x to happen OB. there may or may not be any causal relationship between x and y OC. x causes y to happen OD. both A and B are correct answers If the coefficient of correlation is -0.60, then the coefficient of determination is: OA. -0.60 OB. 0.40 OC. -0.36 OD. 0.36arrow_forwardAn r value of .8 indicates a strong positive correlation. True Falsearrow_forward
- A scatterplot is made of the average height (x axis) and average blood temperature (y axis) of 200 different mammals. The correlation is medially positive, approximately around r = 0.6. Human is at the 2 SD below the average on height and approximately 1.2 SD below the average on blood temperature. This implies this point is... Group of answer choices No answer text provided. on the SD line it is impossible to say with the information given on the regression linearrow_forwardThe correlation between midterm and final grades for 300 students is 0.620. If 5 points are added to each midterm grade, the new r will be: a. 0.124 b. 0.57 c. 0.62 d. 0.744arrow_forwardPlease round all answers to 2 decimal places. Given the table below, use your calculator to find the Correlation Coefficient x3.44.69.3105.34.9y15.511.220.222.710.814.3 Put your answer here:arrow_forward
- The following statement contains an error. Choose the statement that best explains the error. "The correlation between shoe size and height is 0.87 inches" A. Correlation requires that both of the variables be categorical B. When stating the correlation coefficient, one must state whether it is a positive or negative relationship C. This statement does not tell us whether or not shoe size is correlated with height D. When reporting correlation, one does not report units because correlation has no units E. There is no error in this statementarrow_forwardA random sample of college students was surveyed about how they spend their time each week. The scatterplot below displays the relationship between the number of hours each student typically works per week at a part- or full-time job and the number of hours of television each student typically watches per week. The correlation between these variables is r = –0.63, and the equation we would use to predict hours spent watching TV based on hours spent working is as follows: Predicted hours spent watching TV = 17.21 – 0.23(hours spent working) Since we are using hours spent working to help us predict hours spent watching TV, we’d call hours spent working a(n) __________________ variable and hours spent watching TV a(n) __________________ variable. The correlation coefficient, along with what we see in the scatterplot, tells us that the relationship between the variables has a direction that is _________________ and a strength that is ______________________. According to the…arrow_forwardIdentifying individuals with a high risk of Alzheimer's disease usually involves a long series of cognitive tests. However, researchers have developed a 7-Minute Screen, which is a quick and easy way to accomplish the same goal. The question is whether the 7-Minute Screen is as effective as the complete series of tests. To address this question, Ijuin et al. (2008) administered both tests to a group of patients and compared the results. The following data represent results similar to those obtained in the study. 7-Minute Screen Cognitive Series 3 11 8 19 10 22 8 20 4 14 7 13 4 9 5 20 14 25 Which statistical test would you select: Answer H0: Answer H1: Answer What is the coefficient that indicates the strength of the relationship? Answer =Answer What is the standard error? Answer What is the appropriate 95% CI? [ Answer , Answer ] What is the d-effect size? Answer What is the t-observed? Answer What is the actual p-value? Answer THREE decimal places…arrow_forward
- Use the data in the table, which shows the average annual salaries (both in thousands of dollars) for public school principals and teachers in the U.S. for 11 years. Apply what you have learned in the previous tab to complete this graded lab questions. 1. Repeat the steps from tab #1 using this data to construct a scatter plot graph and calculate the correlation coefficient R. (Recall the corelation coefficient is R and not R Teachers y Principalsx 77.8 43.7 78.4 43.8 80.8 45.0 R= 80.5 45.6, 2. Does the R value represent a positive, negative or no correlation between the salaries ol the teachers and principals? As teacher salaries increase, what happens to prinicipal salaries? 10 11 81.5 45.9 84.8 48.2 12 13 87.7 49,3 3. Write the equation of the regression line for the data below. The equation is y= 14 91.6 51.3 52.9 Teachers y 15 16 95.7 54.4 COD 54.2 =D0.5873x-2.0s07o R=0.995, 17 95.7 4. Use the regression equation that you found in exercise #3 to predict the average annual salary…arrow_forwardPlease round all answers to 2 decimal places.Given the table below, use your calculator to find the Correlation Coefficient xx 2.6 9.1 8.3 7.9 2.9 4.9 yy 6.2 22.9 24.2 20.1 6.1 15.8 Put your answer here:arrow_forwardFor each of the following, indicate whether a correlation is most likely POSITIVE, NEGATIVE or NC (no correlation possible). The number of calories consumed and a person's weight loss The age of a child and the kind of pets owned Number of hours spent partying and GPA The age of a car and its mileage Weekly ice cream sales and weekly average temperaturearrow_forward
arrow_back_ios
SEE MORE QUESTIONS
arrow_forward_ios
Recommended textbooks for you
 MATLAB: An Introduction with ApplicationsStatisticsISBN:9781119256830Author:Amos GilatPublisher:John Wiley & Sons Inc
 Probability and Statistics for Engineering and th...StatisticsISBN:9781305251809Author:Jay L. DevorePublisher:Cengage Learning
 Statistics for The Behavioral Sciences (MindTap C...StatisticsISBN:9781305504912Author:Frederick J Gravetter, Larry B. WallnauPublisher:Cengage Learning
 Elementary Statistics: Picturing the World (7th E...StatisticsISBN:9780134683416Author:Ron Larson, Betsy FarberPublisher:PEARSON
 The Basic Practice of StatisticsStatisticsISBN:9781319042578Author:David S. Moore, William I. Notz, Michael A. FlignerPublisher:W. H. Freeman
 Introduction to the Practice of StatisticsStatisticsISBN:9781319013387Author:David S. Moore, George P. McCabe, Bruce A. CraigPublisher:W. H. Freeman

MATLAB: An Introduction with Applications
Statistics
ISBN:9781119256830
Author:Amos Gilat
Publisher:John Wiley & Sons Inc

Probability and Statistics for Engineering and th...
Statistics
ISBN:9781305251809
Author:Jay L. Devore
Publisher:Cengage Learning

Statistics for The Behavioral Sciences (MindTap C...
Statistics
ISBN:9781305504912
Author:Frederick J Gravetter, Larry B. Wallnau
Publisher:Cengage Learning

Elementary Statistics: Picturing the World (7th E...
Statistics
ISBN:9780134683416
Author:Ron Larson, Betsy Farber
Publisher:PEARSON

The Basic Practice of Statistics
Statistics
ISBN:9781319042578
Author:David S. Moore, William I. Notz, Michael A. Fligner
Publisher:W. H. Freeman

Introduction to the Practice of Statistics
Statistics
ISBN:9781319013387
Author:David S. Moore, George P. McCabe, Bruce A. Craig
Publisher:W. H. Freeman