
MATLAB: An Introduction with Applications
6th Edition
ISBN: 9781119256830
Author: Amos Gilat
Publisher: John Wiley & Sons Inc
expand_more
expand_more
format_list_bulleted
Related questions
Question
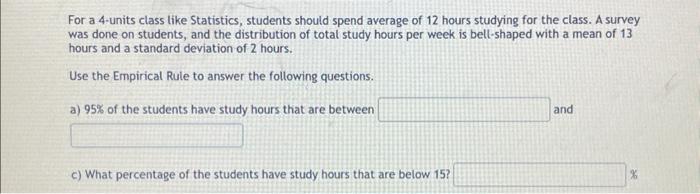

Transcribed Image Text:For a 4-units class like Statistics, students should spend average of 12 hours studying for the class. A survey
was done on students, and the distribution of total study hours per week is bell-shaped with a mean of 13
hours and a standard deviation of 2 hours.
Use the Empirical Rule to answer the following questions.
a) 95% of the students have study hours that are between
c) What percentage of the students have study hours that are below 15?
and
%
Expert Solution
This question has been solved!
Explore an expertly crafted, step-by-step solution for a thorough understanding of key concepts.

This is a popular solution

Trending nowThis is a popular solution!

Step by stepSolved in 4 steps with 6 images

Knowledge Booster

Similar questions
- Fifteen randomly selected college students were asked to state the number of hours they slept the night before. The resulting data are: 6 16 7 8 7 796 3 11 9 15 4 7 9 a) Find the mean. b) Find the median. c) Find the standard deviation. d) According to Chebysev's Theorem, at least 75% of the times will fall between what two amounts? Is the theorem accurate for this set of data? Why of Why not? e) Are any of the reported hours "unusually" high? Are any of the reported hours unusually low?arrow_forwardThe average house has 14 paintings on its walls. Is the mean larger for houses owned by teachers? The data show the results of a survey of 14 teachers who were asked how many paintings they have in their houses. Assume that the distribution of the population is normal. 15, 13, 16, 16, 17, 14, 14, 15, 13, 13, 15, 16, 15, 16 What can be concluded at the a = 0.01 level of significance? a. For this study, we should use Select an answer b. The null and alternative hypotheses would be: Но: ? Select an answer v H: ?v Select an answer v c. The test statistic ? v = (please show your answer to 3 decimal places.) d. The p-value = (Please show your answer to 4 decimal places.) e. The p-value is ? va f. Based on this, we should Select an answer v the null hypothesis. g. Thus, the final conclusion is that ... O The data suggest that the population mean number of paintings that are in teachers' houses is not significantly more than 14 at a = 0.01, so there is insufficient evidence to conclude that…arrow_forwardA researcher wanted to test whether there is a relationship between preferred sweet (Oreo cookies, Mars bars, or Twinkies) and age group (children, adolescents, or young adults). To test that, subjects from the three age groups were asked which of the three sweets they preferred. Which statistical test should be used to analyze the data? 1. chi square test of independece 2. chi square test for goodness of fit 3. one sample t test 4. one way anova testarrow_forward
- For each day of last year, the number of vehicles passing through a certain intersection was recorded by a city engineer. One objective of this study was to determine the percentage of days that more than 425 vehicles used the intersection. If the mean data was 375 vehicles per day and the standard deviation was 25 vehicles: (c) Suppose the relative frequency distribution for the data is bell-shaped, then what percentage of days between 325 and 425 vehicles used the intersection ?arrow_forward2. At the general hospital, the waiting times (in minutes) before seeing the doctor were recorded. A sample of 10 patients was surveyed recently and their waiting times are shown below: 13 15 23 22 19 16 23 17 18 25 Calculate the mean, standard deviation and coefficient of variation.arrow_forwardHeights of men have a mean of 69.0 inches and a standard deviation of 2.8 inches.Find each of the following z-scores and tell if it is unusual. a) Nosferatu is 7 ft. 1 in. tall: z = and that is (unusual/not unusual) b) Bob the Builder is 5 ft. 4 in. tall: z = and that is (unusual/not unusual) c) Kendrick is 69.72 inches tall: z = and that is (unusual/not unusual)arrow_forward
- 9. Which measures aren’t resistant? (more than one could be correct) a. mean b. median c. IQR d. Standard deviation e. range f. coefficient of correlationarrow_forwardA. Sam's times varied more over the season that Mike's times. B. Sam's times varied about the same over the season as Brett's times. C. Brett's times varied more over the season than Mike's times. D. Mike's times varied more over the season than Brett's times.arrow_forwardA recent report indicated a typical family spend $650 per month on food. Assume the distribution of food expenditures for a family of five follows a normal distribution, with mean of $650 and standard deviation of $120. A sample of 64 is taken. a) What percentage of the families spends more than $675 per month on food? b) What percentage of the families spends less than $660 per month on food? c) What percentage of the families spends between $660 and $670 per month on food? d) What percentage of the families spends less than $650 or more than $675 per month onarrow_forward
arrow_back_ios
arrow_forward_ios
Recommended textbooks for you
- MATLAB: An Introduction with ApplicationsStatisticsISBN:9781119256830Author:Amos GilatPublisher:John Wiley & Sons Inc
 Probability and Statistics for Engineering and th...StatisticsISBN:9781305251809Author:Jay L. DevorePublisher:Cengage Learning
 Statistics for The Behavioral Sciences (MindTap C...StatisticsISBN:9781305504912Author:Frederick J Gravetter, Larry B. WallnauPublisher:Cengage Learning
  Elementary Statistics: Picturing the World (7th E...StatisticsISBN:9780134683416Author:Ron Larson, Betsy FarberPublisher:PEARSON
 The Basic Practice of StatisticsStatisticsISBN:9781319042578Author:David S. Moore, William I. Notz, Michael A. FlignerPublisher:W. H. Freeman
 Introduction to the Practice of StatisticsStatisticsISBN:9781319013387Author:David S. Moore, George P. McCabe, Bruce A. CraigPublisher:W. H. Freeman
MATLAB: An Introduction with Applications
Statistics
ISBN:9781119256830
Author:Amos Gilat
Publisher:John Wiley & Sons Inc
Probability and Statistics for Engineering and th...
Statistics
ISBN:9781305251809
Author:Jay L. Devore
Publisher:Cengage Learning
Statistics for The Behavioral Sciences (MindTap C...
Statistics
ISBN:9781305504912
Author:Frederick J Gravetter, Larry B. Wallnau
Publisher:Cengage Learning
Elementary Statistics: Picturing the World (7th E...
Statistics
ISBN:9780134683416
Author:Ron Larson, Betsy Farber
Publisher:PEARSON
The Basic Practice of Statistics
Statistics
ISBN:9781319042578
Author:David S. Moore, William I. Notz, Michael A. Fligner
Publisher:W. H. Freeman
Introduction to the Practice of Statistics
Statistics
ISBN:9781319013387
Author:David S. Moore, George P. McCabe, Bruce A. Craig
Publisher:W. H. Freeman