
ENGR.ECONOMIC ANALYSIS
14th Edition
ISBN: 9780190931919
Author: NEWNAN
Publisher: Oxford University Press
expand_more
expand_more
format_list_bulleted
Related questions
Question
sub abc have been solved, pls help me D and E, thank you.
A1=2710.336
A2=2659.384
A3=386,455.172
A4= 378,225.721
b) Real
Nominal GDP growth rate in 2020=(2688.54−2844.56)/2844.56*100)= −5.48%
population size= Real GDP/ Real GDP per capita
= 2,671.569 billions/359647.43unit=0.0074 billion
c) Inflation rate increment on the grounds that An increment in inflation implies that costs have risen. With an expansion in inflation, there is a decrease in the buying influence of cash, which lessens utilization and thusly GDP decreases. from the information we can see GDP decreases.

Transcribed Image Text:Statistics
Units
2016
2017
2018
2019
2020
Real GDP
National
A1
2,813.09
2,893.16
2,844.56
2,671.57
(billions)
currency
National
Nominal GDP
2,490.44
A2
2,835.12
2,844.56
2,688.54
(billions)
Real GDP per
currency
National
367,398.57 379,474.85
АЗ
378,225.72 359,647.43
сapita
currency
National
Nominal GDP
337,590.38 358,741.15 | 378,702.58
A4
361,931.53
per capita
Unemployment Percentage
currency
3.393
3.127
2.815
2.932
5.828
rate
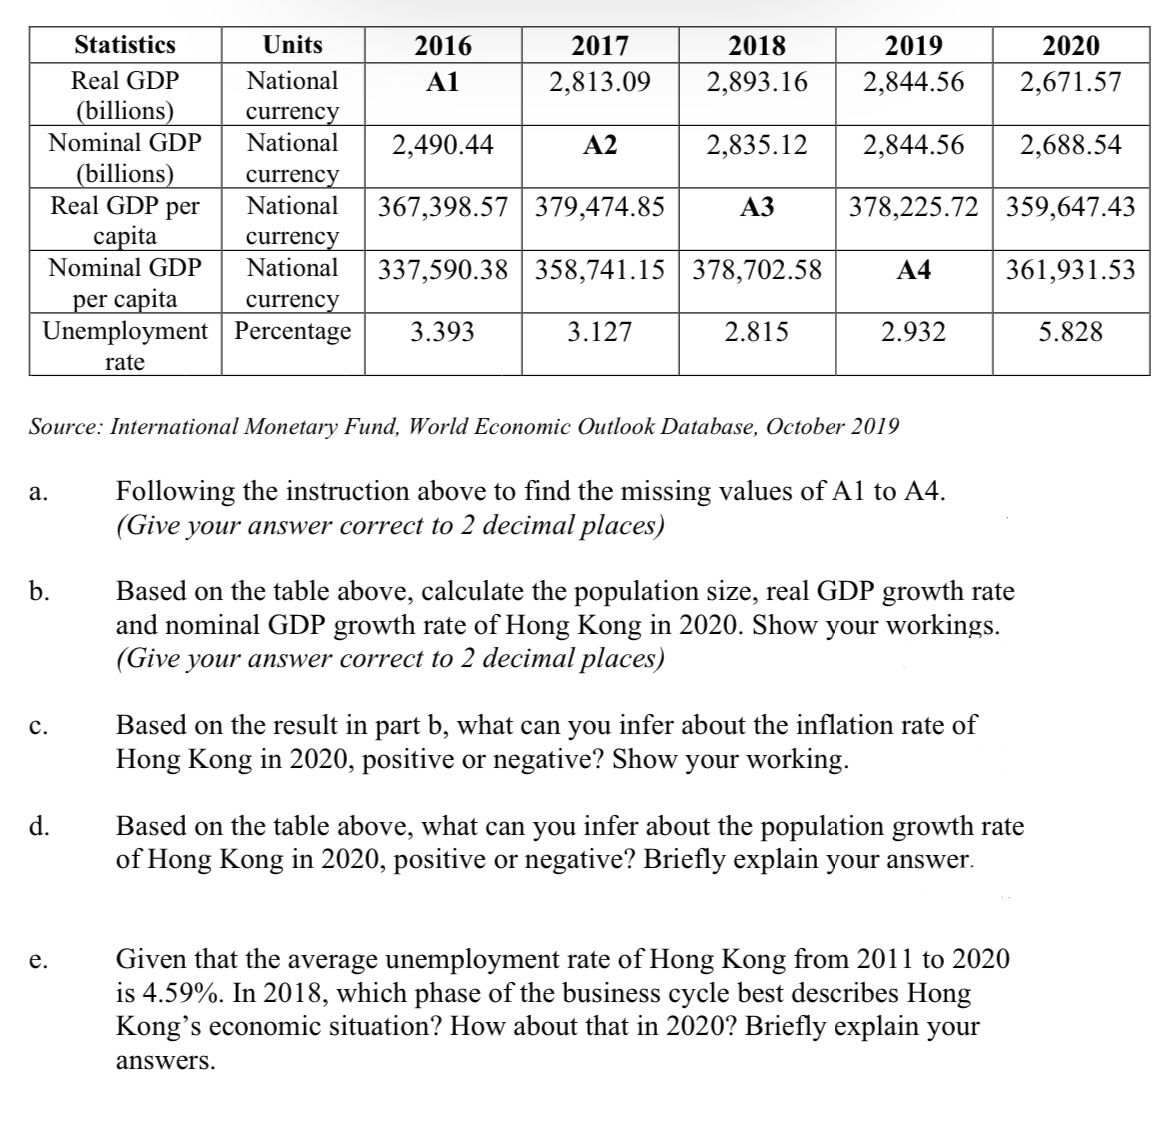
Source: International Monetary Fund, World Economic Outlook Database, October 2019
Following the instruction above to find the missing values of A1 to A4.
(Give your answer correct to 2 decimal places)
а.
b.
Based on the table above, calculate the population size, real GDP growth rate
and nominal GDP growth rate of Hong Kong in 2020. Show your workings.
(Give your answer correct to 2 decimal places)
Based on the result in part b, what can you infer about the inflation rate of
Hong Kong in 2020, positive or negative? Show
с.
your working.
d.
Based on the table above, what can you infer about the population growth rate
of Hong Kong in 2020, positive or negative? Briefly explain your answer.
Given that the average unemployment rate of Hong Kong from 2011 to 2020
is 4.59%. In 2018, which phase of the business cycle best describes Hong
Kong's economic situation? How about that in 2020? Briefly explain your
е.
answers.

Transcribed Image Text:v 12 v A A
自動換行
通用格式
山填滿v
X剪下
新細明體
格式
條件式格式 格式化為儲存格
設定。
插人
刪除
临複製、
貼上
BIU a
A + v
國跨欄置中
表格、 樣式
清除。
《複製格式
樣式
儲存格
編輯
對齊方式
數值
反
字型
員原
剪貼簿
不要再顯示
另存新檔..
可能發生資料遺失如果將活夏簿儲存為文字(bxt) 格式,會這失部分功能,若要保留這些功能,請將活夏簿儲存為 Excel 檔案格式,
v : Xv fx
K
M
E
F
A
2020 Estimates Start After
2,671.57
2,688.54
359,647.43
361,931.53
Scale
Country/S
2016
2017
2018
2019
Units
1 Country Subject Descriptor
2 Hong Kon Gross domestic product, constant prices
3 Hong Kon Gross domestic product, current prices
4 Hong Kon Gross domestic product per capita, constant prices
5 Hong Kon Gross domestic product per capita, current prices
6 Hong Kon Unemployment rate
2020
2,813.09
2,659.38
379,474.85
358,741.15
3.127
2,844.56
2,844.56
386,455.17 378,225.72
378,702.58 378,225.72
2.932
2,893.16
2,835.12
2,710.34
2,490.44
367,398.57
337,590.38
National currency
Billions
Source: Na
2020
Billions Source: Na
National currency
National currency
National currency
2020
Units
See notes
2020
Units
See notes I
Percent of total labor force
Source: Na
3.393
2.815
5.828
2020
8 International Monetary Fund, World Economic Outlook Database, October 2021
9.
10
11
12
13
14
15
16
17
18
19
20
21
22
23
WEO Data
p在這裡輸入文字來搜尋
83%
23°C E
A 4)
16:3
英
15/12/2
ideapadGAMING
Esc
F2
F3
F4
F5
F6
F7
F8
F9
F10
F11
F12
Insert
PnSc
Delete
Home
End
lili
Expert Solution
This question has been solved!
Explore an expertly crafted, step-by-step solution for a thorough understanding of key concepts.

Step by stepSolved in 3 steps with 3 images

Knowledge Booster


Learn more about
Need a deep-dive on the concept behind this application? Look no further. Learn more about this topic, economics and related others by exploring similar questions and additional content below.Similar questions
- The population of Eturia is shown in the table below. Population (millions) a. Population growth rate 2018 16 2019 16.56 a. What is the percentage growth in population in the years 2019 and 2020? Enter your response, rounded to one decimal place, in the last row of the table above. b. If the population continues to increase at this rate, it will takearrow_forwardexponential growth equation!! Otherwise will give downvote!!! Thanks in advance!arrow_forwardIn a given year the nominal GDP growth rate is 10%, with inflation and population growth rates of 5% and 2% respectively, then growth rate of real GDP per capita is (%):arrow_forward
- Someone, please help accuratelyarrow_forwardIf real GDP for 2009 is $6400 billion (in 2012 dollars) and nominal GDP for 2010 is $6/20 billion, then the growth rate of real GDP ix Select one a .5% b.0.5% c unknown based on the given information d. 0%.arrow_forwardrowth: Homework Saved years Help Save & Ex Suppose that real GDP per capita in the United States is $53,500. If the long-term growth rate of real GDP per capita is 4.5% per year, how many years will it take for real GDP per capita to reach $107,000? Instructions: Enter your answer as a whole number. Chacarrow_forward
- Nominal GDP (NGDP) Real GDP (RGDP) Estimated Resident Population by Age and Sex (1991+) (Annual-Mar) 3,970,000 4,044,900 4,101,300 4,148,000| 4,196,700 4,235,300 4,271,000 4,317,900 4,362,800 4,392,500 4,417,700 Data 2003 135,181 3,970,000 2004 144,502 4,044,900 2005 154,559 4,101,300 2006 162,937 172,004 4,148,000 2007 4,196,700 2008 186,673 4,235,300 2009 189,406 4,271,000 2010 194,306 4,317,900 Pad 2011 203,342 Page 4,362,800 4,392,500 4,417,700 2012 213,025 2013 217,489arrow_forward51. Suppose per capita GDP in a richer country is growing at a faster annual rate than in a poorer country. An implication of this difference in growth rates is that the gap between their standards of living will close over time as long as the rate of population growth is higher in the poorer country. whether the gap in living standards widens or closes over time depends on the absolute size of the relative growth rates. the gap between their standards of living will widen over time. the gap between their standards of living will close over time. the difference in their living standards will not change over time.arrow_forwardSelect and analyze global productivity trends from 1970 to the present year. Describe the GDP per capita trend for each country. Compare these trends across the different income levels represented. Identify any significant trend changes and hypothesize possible causes related to events or policies.arrow_forward
- 11) The relationship between the growth rate of an economic variable, gt, and its level, yt, can be approximated by A) gt = yt - yt - 1. B) gt = logt - log yt - 1. C) yt = log gt - log gt - 1. D) log gt = yt - yt - 1. 12) The business cycle component of the log of real per-capita GNP is equal to A) log of actual real GNP - log of trend GNP. B) log of trend GNP ÷ log of actual real GNP. C) log of trend GNP - log of actual real GNP. D) log of actual real GNP ÷ log of trend GNP. 13) For the study of economic growth, it is most helpful to examine movements in ________; for the study of business cycles, it is most helpful to examine movements in ________. A) trend GNP; trend GNP B) trend GNP; deviations from trend in GNP C) deviations from trend in GNP; trend GNP D) deviations from trend in GNP; deviations from trend in GNP 14) Over the twentieth century, growth in per-capita GNP was highest A) immediately prior to the Great…arrow_forwardSuppose that real GDP per capita in the United States is $49,000. If the long-term growth rate of real GDP per.capita is 1.6% per year, how many years will it take for real GDP per capita to reach $98,000? Instructions: Enter your answer as a whole number. years ( Prev 5 of 5 Nextarrow_forward5. The real GDP per capita in Colombia was $3,692 in 2000 and $5,889 in 2020. What is the average annual growth rate of the real GDP per capita from 2000 to 2020? Please use the log formula.arrow_forward
arrow_back_ios
SEE MORE QUESTIONS
arrow_forward_ios
Recommended textbooks for you
 Principles of Economics (12th Edition)EconomicsISBN:9780134078779Author:Karl E. Case, Ray C. Fair, Sharon E. OsterPublisher:PEARSON
 Engineering Economy (17th Edition)EconomicsISBN:9780134870069Author:William G. Sullivan, Elin M. Wicks, C. Patrick KoellingPublisher:PEARSON
 Principles of Economics (MindTap Course List)EconomicsISBN:9781305585126Author:N. Gregory MankiwPublisher:Cengage Learning
 Managerial Economics: A Problem Solving ApproachEconomicsISBN:9781337106665Author:Luke M. Froeb, Brian T. McCann, Michael R. Ward, Mike ShorPublisher:Cengage Learning
 Managerial Economics & Business Strategy (Mcgraw-...EconomicsISBN:9781259290619Author:Michael Baye, Jeff PrincePublisher:McGraw-Hill Education
Principles of Economics (12th Edition)
Economics
ISBN:9780134078779
Author:Karl E. Case, Ray C. Fair, Sharon E. Oster
Publisher:PEARSON
Engineering Economy (17th Edition)
Economics
ISBN:9780134870069
Author:William G. Sullivan, Elin M. Wicks, C. Patrick Koelling
Publisher:PEARSON
Principles of Economics (MindTap Course List)
Economics
ISBN:9781305585126
Author:N. Gregory Mankiw
Publisher:Cengage Learning
Managerial Economics: A Problem Solving Approach
Economics
ISBN:9781337106665
Author:Luke M. Froeb, Brian T. McCann, Michael R. Ward, Mike Shor
Publisher:Cengage Learning
Managerial Economics & Business Strategy (Mcgraw-...
Economics
ISBN:9781259290619
Author:Michael Baye, Jeff Prince
Publisher:McGraw-Hill Education