
MATLAB: An Introduction with Applications
6th Edition
ISBN: 9781119256830
Author: Amos Gilat
Publisher: John Wiley & Sons Inc
expand_more
expand_more
format_list_bulleted
Related questions
Question
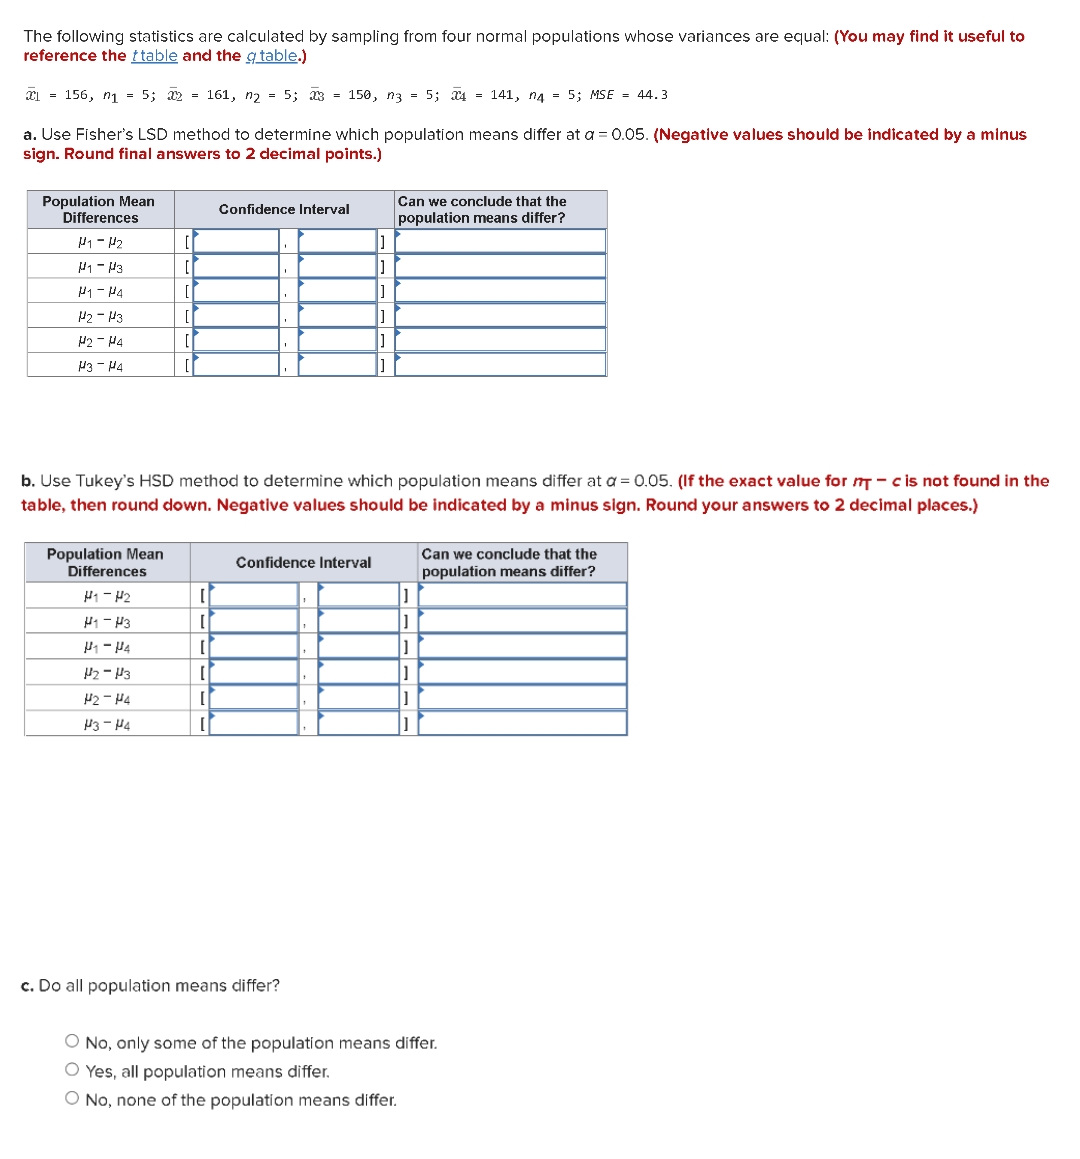

Transcribed Image Text:The following statistics are calculated by sampling from four normal populations whose variances are equal: (You may find it useful to
reference the t table and the g table.)
al = 156, n1 = 5; a2 = 161, ng = 5; 3 = 150, n3 = 5; x4 = 141, n4 = 5; MSE = 44.3
a. Use Fisher's LSD method to determine which population means differ at a = 0.05. (Negative values should be indicated by a minus
sign. Round final answers to 2 decimal points.)
Population Mean
Differences
Can we conclude that the
population means differ?
Confidence Interval
P1 - 42
1 - 13
P1- H4
P2 - P3
H2 - H4
P3 - 44
b. Use Tukey's HSD method to determine which population means differ at a = 0.05. (If the exact value for m -c is not found in the
table, then round down. Negative values should be indicated by a minus sign. Round your answers to 2 decimal places.)
Population Mean
Differences
Can we conclude that the
Confidence Interval
population means differ?
H1 - 42
P1 - P3
P1 - H4
P3 - P4
c. Do all population means differ?
O No, only some of the population means differ.
O Yes, all population means differ.
O No, none of the population means differ.
Expert Solution
This question has been solved!
Explore an expertly crafted, step-by-step solution for a thorough understanding of key concepts.

Step by stepSolved in 2 steps

Knowledge Booster

Similar questions
- Data on the fuel economy of several 2010 model vehicles are given in the accompanying table. Complete parts (a) and (b) below. Click the icon to view the table of fuel economy data. a) Find and interpret a 95% confidence interval for the gas mileage of 2010 vehicles. Select the correct choice below and fill in the answer boxes within your choice. (Round to two decimal places as needed. Use ascending order.) OA. 95% of all cars like the ones in the sample have gas mileages between mpg and mpg. mpg and mpg. OB. One is 95% confident that the gas mileage of a randomly selected car like the ones in the sample is between OC. One is 95% confident that the true mean gas mileage for cars like the ones in the sample is between D. The true mean gas mileage for cars like the ones in the sample is between mpg and mpg 95% of the time. mpg and mpg. b) Does this confidence interval capture the mean gas mileage for all 2010 vehicles? Choose the correct answer below. 4 OA. There is a 95% chance that…arrow_forwardAssume that a sample is used to estimate a population proportion p. Find the 98% confidence interval for a sample of size 257 with 50% successes. Enter your answer as an open-interval (i.e., parentheses) using decimals (not percents) accurate to three decimal places.C.I. =arrow_forwardFind the sample size needed to estimate the percentage of adults who can wiggle their ears. Use a margin of error of 2 percentage points and use a confidence level of 95%. Complete parts (a) and (b) below. a. Assume that p and q are unknown. р n= (Round up to the nearest integer.) b. Assume that 21% of adults can wiggle their ears. n= (Round up to the nearest integer.)arrow_forward
- Consider the simple random sample of vehicle speeds below. Use the data to construct 3 different confidence intervals. We'll keep the sample size constant and vary the level of confidence, amd note the pattern that appears. Round results to 1 decimal place. * = 63 mph s = 10 mph n = 50 1. Construct the 80% confidence interval for vehicle speeds. 2. Construct the 90% confidence interval for vehicle speeds. 3. Construct the 99% confidence interval for vehicle speeds In 1- 2 complete sentences describe the effect increasing the level of confidence on the confidence interval.arrow_forwardPlease answer question a, b and carrow_forwardUse the confidence level and sample data to find a confidence interval for estimating the population μ. Round your answer to two decimals. 13) A random sample of 100 individuals, their blood glucose level has been measured, obtaining a mean of 120 mg/dl and a standard deviation of 30 mg/dl. a) What is the best point estimate of the population mean? b) Construct a 95% confidence interval for the mean blood glucose level of all individuals in this population.arrow_forward
- Use the following data set: 40, 33, 77, 12, 23, 56, 23, 19, 29 (minutes). Assume the data is approximately bell shaped and a sample.arrow_forwardUse the sample data and confidence level given below to complete parts (a) through (d). A research institute poll asked respondents if they felt vulnerable to identity theft. In the poll, n = 1004 and x = 544 who said "yes." Use a 90% confidence level. Click the icon to view a table of z scores. a) Find the best point estimate of the population proportion p. (Round to three decimal places as needed.) Standard Normal (z) Distribution Z 0.0 0.1 0.2 0.3 0.4 0.5 0.6 0.7 0.8 0.9 1.0 1.1 1.2 12 .00 5000 5398 .5793 .6179 .6554 .6915 .7257 .7580 .7881 .8159 .8413 .8643 .8849 0022 0 Z Cumulative Area from the LEFT .01 .5040 .5438 .5832 .6217 .6591 .6950 .7291 .7611 .7910 .8186 .8438 .8665 .8869 0040 .02 .5080 .5478 .5871 .6255 .6628 .6985 .7324 .7642 .7939 .8212 .8461 .8686 .8888 POSITIVE Z Scores ՈՈՐԸ .03 .5120 .5517 .5910 .6293 .6664 .7019 .7357 .7673 .7967 .8238 .8485 .8708 .8907 anon .04 5160 .5557 .5948 .6331 .6700 .7054 .7389 .7704 .7995 .8264 .8508 .8729 .8925 0000 .05 .5199 5596 .5987…arrow_forward7. use the given confidence interval to find the margin of error and the sample proportion. a. (0.719,0.745) b. (0.753,0.777)arrow_forward
arrow_back_ios
arrow_forward_ios
Recommended textbooks for you
- MATLAB: An Introduction with ApplicationsStatisticsISBN:9781119256830Author:Amos GilatPublisher:John Wiley & Sons Inc
 Probability and Statistics for Engineering and th...StatisticsISBN:9781305251809Author:Jay L. DevorePublisher:Cengage Learning
 Statistics for The Behavioral Sciences (MindTap C...StatisticsISBN:9781305504912Author:Frederick J Gravetter, Larry B. WallnauPublisher:Cengage Learning
  Elementary Statistics: Picturing the World (7th E...StatisticsISBN:9780134683416Author:Ron Larson, Betsy FarberPublisher:PEARSON
 The Basic Practice of StatisticsStatisticsISBN:9781319042578Author:David S. Moore, William I. Notz, Michael A. FlignerPublisher:W. H. Freeman
 Introduction to the Practice of StatisticsStatisticsISBN:9781319013387Author:David S. Moore, George P. McCabe, Bruce A. CraigPublisher:W. H. Freeman
MATLAB: An Introduction with Applications
Statistics
ISBN:9781119256830
Author:Amos Gilat
Publisher:John Wiley & Sons Inc
Probability and Statistics for Engineering and th...
Statistics
ISBN:9781305251809
Author:Jay L. Devore
Publisher:Cengage Learning
Statistics for The Behavioral Sciences (MindTap C...
Statistics
ISBN:9781305504912
Author:Frederick J Gravetter, Larry B. Wallnau
Publisher:Cengage Learning
Elementary Statistics: Picturing the World (7th E...
Statistics
ISBN:9780134683416
Author:Ron Larson, Betsy Farber
Publisher:PEARSON
The Basic Practice of Statistics
Statistics
ISBN:9781319042578
Author:David S. Moore, William I. Notz, Michael A. Fligner
Publisher:W. H. Freeman
Introduction to the Practice of Statistics
Statistics
ISBN:9781319013387
Author:David S. Moore, George P. McCabe, Bruce A. Craig
Publisher:W. H. Freeman