MATLAB: An Introduction with Applications
6th Edition
ISBN: 9781119256830
Author: Amos Gilat
Publisher: John Wiley & Sons Inc
expand_more
expand_more
format_list_bulleted
Question

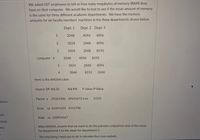
Transcribed Image Text:We asked UST employees to tell us how many megabytes of memory (RAM) they
have on their computer. We would like to test to see if the mean amount of memory
is the same for three different academic departments. We have the memory
amounts for six faculty members' machines in the three departments shown below.
Dept. 1
Dept. 2 Dept. 3
1
2048
4096 4096
2
1024
2048 4096
3
1024
2048 8192
computer 4
2048
4096 8192
1024
2048
4096
6.
2048
8192
2048
Here is the ANOVA table:
Source DF Adj SS
Adj MS
F-Value P-Value
Factor x 39263346 19631673 x.xx
0.025
ations
Error xx 61691221 4112748
365
Total
XX 100954567
Help
After ANOVA, assume that we want to do the pairwise comparison test of the mean
Pro
for department 1 to the mean for department 2.
The only thing I need you to do is calculate the t test statistic.
dango

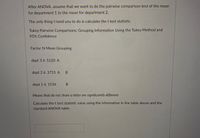
Transcribed Image Text:After ANOVA, assume that we want to do the pairwise comparison test of the mean
for department 1 to the mean for department 2.
The only thing I need you to do is calculate the t test statistic.
Tukey Pairwise Comparisons: Grouping Information Using the Tukey Method and
95% Confidence
Factor N Mean Grouping
dept 3 6 5120 A
dept 2 6 3755 A B
dept 1 6 1536
Means that do not share a letter are significantly different.
Calculate the t test statistic value using the information in the table above and the
standard ANOVA table.
Expert Solution
This question has been solved!
Explore an expertly crafted, step-by-step solution for a thorough understanding of key concepts.
This is a popular solution
Trending nowThis is a popular solution!
Step by stepSolved in 2 steps with 2 images

Knowledge Booster
Similar questions
- The chart below shows the numbers of endangered and threatened species both in the United States and abroad. Endangered Threatened United States Foreign United States Foreign Mammals 65 251 8 20 Birds 86 170 19 9 Reptiles 20 65 25 14 Amphibians 15 8 8 1 P(mammal or threatened foreign species)=arrow_forwardA pollster wants to minimize the effect the order of the questions has on a person's response to a survey. How many different surveys are required to cover all possible arrangements if there are 12 questions on the survey? Question content area bottom Part 1 A.39 comma 916 comma 800 39,916,800 B.479 comma 001 comma 600 479,001,600 C.144 144 D.12 12arrow_forwardFind the mode of the following list of weights (in pounds) of Boston terriers at a pet store. 17,12,8,21,8,16,12,8,21,16,8arrow_forward
- A researcher is interested in the affects that a person’s avatar (i.e. visual representation of oneself) has on the number of profile views on Facebook.com. The average number of individual personal profile views is known to be 230 views per day (excluding bands, artists, etc.). The researcher creates 36 fictitious profiles that contain roughly the same information but the picture (avatar) is an animated .gif of a smiling face (36 faces randomly selected from a compilation of faces judged to be of average attractiveness). The results showed that of the 36 profiles the average number of views was 250 with a standard deviation of 60. Test the hypothesis that the average number of views for a smiling face gif is significantly different than the usual number of personal profile views.arrow_forwardThe table shows the leading causes of death in a certain country in a recent year. The population of the country was 311311 million. If you lived in a typical city of 500,000, how many people would you expect to die of cancercancer each year? Cause Deaths Cause Deaths Heart disease 596 comma 700596,700 Alzheimer's disease 84 comma 90084,900 Cancer 575 comma 300575,300 Diabetes 73 comma 40073,400 Chronic respiratory diseases 143 comma 100143,100 Pneumonia/Influenza 53 comma 40053,400 Stroke 128 comma 600128,600 Kidney disease 45 comma 30045,300 Accidents 122 comma 500122,500 Suicide 38 comma 60038,600 About people would be expected to die of cancer each year. (Type a whole number. Round to the nearest person as needed.)arrow_forwardIf 30 participants each completed a memory task three times — once each after having no, moderate, or high levels of caffeine, calculate the total degrees of freedom.arrow_forward
- A1 1 2 3 7 5 5 7 B 9 0 1 2 3 4 5 6 7 8 9 0 1 2 3 4 5 6 7 8 9 0 1 2 A Day 1 2 3 4 5 6 7 8 9 10 11 12 13 14 15 16 17 18 19 20 21 22 23 24 25 26 27 28 29 30 X B Discharged_Patients A 54 63 110 105 131 137 80 63 75 92 105 112 120 95 72 128 126 106 129 136 94 74 107 135 124 113 140 83 62 106 fx Day с Records_not_Processed 18 18 52 29 70 57 26 29 14 27 49 38 47 26 28 49 45 39 27 38 44 25 29 62 44 60 46 38 25 39 D E F G H I Jarrow_forwardThe following data are stored in the variable called "data": 2 3 4 7 1 1 0 9 4 2 3 1 Write the MATLAB command that will set the variables equal to the indicated portion of data: 2347 Y =1109 MATLAB Command: Y = 4231 2347 X= 791 MATLAB Command: X = 7 3 Z= 9 1 MATLAB Command: Z = 1 2 4 S= 0 MATLAB Command: S = 3arrow_forwardA researcher wants to know how long it takes, on average, for a certain species of bacteria to divide. She watches 17 cells through a microscope and times how long it takes them to divide. She obtains the following data, in hours:6.7, 10.5, 4.8, 5.2, 5.2, 10.6, 4.4, 5.7, 10.9, 7.5, 5.3, 4.4, 5.7, 5.2, 6.9, 4.5, 7.7Assuming the population standard deviation is σ=2σ=2, construct a 94% confidence interval for the average time it takes this species of bacteria to divide.xˉ=x̄=α2=α2=zα2=zα2=Margin of Error: E=E=We are 94% confident that this species of bacteria takes, on average, between hours and hours to divide.___arrow_forward
- (For Questions 17-19 and 20-24). The following data was collected from a clinical trial testing a new drug aimed to lower blood pressure for individuals older than age 45. Half of the 20 participants received the new drug (Treatment = Yes) and the other half of the participants received a placebo pill (Treatment = No). Their age and gender was also recorded. Please use this data for Questions 17-19 and 20-24 and note, not all the information in the table will be used for either problem, you must decide what is relevant based on what the problem is asking. Subject ID Treatment Age Gender BP_Before BP_After D1 Yes 65 F 103.3 80.5 D2 Yes 59 F 93.6 85.9 D3 Yes 60 M 92 85.2 D4 Yes 54 F 93 87.8 D5 Yes 65 F 95.4 85.3 D6 Yes 57 M 109.6 94.2 D7 Yes 69 M 97.9 83.9 D8 Yes 62 M 96 85 D9 Yes 49 F 98.4 86.3 D10 Yes 45 M 98.4 90 C1 No 63 F…arrow_forwardplease complete the blank problem and or ones with a red x next to it not ones with a green check next to pleasearrow_forward
arrow_back_ios
arrow_forward_ios
Recommended textbooks for you
 MATLAB: An Introduction with ApplicationsStatisticsISBN:9781119256830Author:Amos GilatPublisher:John Wiley & Sons Inc
 Probability and Statistics for Engineering and th...StatisticsISBN:9781305251809Author:Jay L. DevorePublisher:Cengage Learning
 Statistics for The Behavioral Sciences (MindTap C...StatisticsISBN:9781305504912Author:Frederick J Gravetter, Larry B. WallnauPublisher:Cengage Learning
 Elementary Statistics: Picturing the World (7th E...StatisticsISBN:9780134683416Author:Ron Larson, Betsy FarberPublisher:PEARSON
 The Basic Practice of StatisticsStatisticsISBN:9781319042578Author:David S. Moore, William I. Notz, Michael A. FlignerPublisher:W. H. Freeman
 Introduction to the Practice of StatisticsStatisticsISBN:9781319013387Author:David S. Moore, George P. McCabe, Bruce A. CraigPublisher:W. H. Freeman

MATLAB: An Introduction with Applications
Statistics
ISBN:9781119256830
Author:Amos Gilat
Publisher:John Wiley & Sons Inc

Probability and Statistics for Engineering and th...
Statistics
ISBN:9781305251809
Author:Jay L. Devore
Publisher:Cengage Learning

Statistics for The Behavioral Sciences (MindTap C...
Statistics
ISBN:9781305504912
Author:Frederick J Gravetter, Larry B. Wallnau
Publisher:Cengage Learning

Elementary Statistics: Picturing the World (7th E...
Statistics
ISBN:9780134683416
Author:Ron Larson, Betsy Farber
Publisher:PEARSON

The Basic Practice of Statistics
Statistics
ISBN:9781319042578
Author:David S. Moore, William I. Notz, Michael A. Fligner
Publisher:W. H. Freeman

Introduction to the Practice of Statistics
Statistics
ISBN:9781319013387
Author:David S. Moore, George P. McCabe, Bruce A. Craig
Publisher:W. H. Freeman