
MATLAB: An Introduction with Applications
6th Edition
ISBN: 9781119256830
Author: Amos Gilat
Publisher: John Wiley & Sons Inc
expand_more
expand_more
format_list_bulleted
Related questions
Question
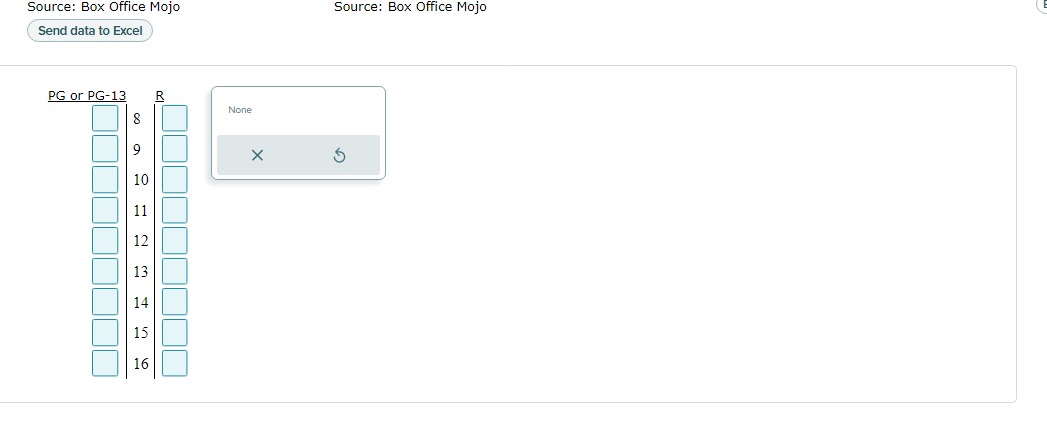

Transcribed Image Text:Source: Box Office Mojo
Send data to Excel
PG or PG-13
8
9
10
11
12
13
14
15
16
J
None
X
Source: Box Office Mojo

Transcribed Image Text:Following are the running times (in minutes) for the 12 top-grossing movies rated PG or PG-13, and the 12 top-grossing movies rated R, for the recent
weekend. Construct back-to-back stem-and-leaf plots for these data sets. If there are no leaves on a particular stem, select the "None" button.
Movies rated PG or PG-13
Movies rated R
The Hobbit: An Unexpected Journey
166
A Good Day to Die Hard
97
Snitch
112
Dead Man Down
110
Lincoln
145
Spring Breakers
94
Safe Haven
115
Phantom
97
Dark Skies
97
Parker
118
Escape From Planet Earth
89
Silver Linings Playbook
122
Warm Bodies
97
Hansel and Gretel: Witch Hunters
88
The Last Exorcism Part II
88
Identity Thief
111
127
Django Unchained
165
Oz The Great and Powerful
Emperor
98
Zero Dark Thirty
157
Wreck-It Ralph
108
No
118
Jack the Giant Slayer
114
21 and Over
93
Source: Box Office Mojo
Source: Box Office Mojo
Send data to Excel
Expert Solution
This question has been solved!
Explore an expertly crafted, step-by-step solution for a thorough understanding of key concepts.

This is a popular solution

Trending nowThis is a popular solution!

Step by stepSolved in 2 steps with 1 images

Knowledge Booster

Similar questions
- In marketing children’s products, it is extremely important to produce television commercials that hold the attention of the children who view them. A psychologist hired by a marketing research firm wants to determine whether differences in attention span exist among advertisements for different types of products. A number of children under 10 years of age are asked to watch one 60-second commercial for one of three types of products, and their attention spans are measured in seconds. The results are shown in the accompanying table: Type of Product Advertised Toys/Games Food/Candy Children’s Clothing 42 55 30 45 58 35 48 52 42 40 60 32 50 57 38 b). What type of error is possible and describe this error in terms of the problem.arrow_forwardThe weights (to the nearest five pounds) of 30 randomly selected male college students are organized in the histogram. Use the graph to find the median weight. The median weight is pounds. (Type an integer or a decimal.) C Students (frequency) Number 10- 8+ 6- 4- Weight of 30 Male College Students 110 115 120 125 130 135 140 145 150 155 160 165 Weight (pounds) ONarrow_forwardWhich of these can help you visualize data? Select all that apply. O bank statement O circle graph O spreadsheet O table O bar grapharrow_forward
- I need help with the questions 2a,2b and 2c. Describe the shape of the distribution of the data. Which movie has the largest budget With all the data obtained, which genre movie tend to have larger budgets.arrow_forwardB) has more than one answer .. Thank youarrow_forwardThe table below shows the number of books the Jefferson Middle school students readeach month for nine months. If the students read only 101 books for the month of June, which measure of central tendency will have the greatest change?A. All measures will have an equal change.B. The median will have the greatest change.C. The mean will have the greatest change.D. The mode will have the greatest change.arrow_forward
- Virginia polled a large sample of individuals to find the percentage of students with known food allergies and the percentage of students without known food allergies. Which of the following could sufficiently display the data if only the two given categories are to be included? Select the correct answer below: bar graph pie chart either a pie chart or a bar graph neither a pie chart nor a bar grapharrow_forwardFor the following line graph, State at least one type of conclusion that could be made from the data provided for the KPI. Suggest one other data source that would provide more information to make data-driven decisions. Explain what information that source would supply. (I used the clustered bar chart) Examples: 1) The completion KPI measures the percentage of South Texas College students who finished their degree or certificate program within six years. From the line graph, it can be seen that the completion rates have remained nearly constant through the years. Data from the THECB was used in this case. 2) Information about the percentage of students who receive credit for attempted courses is available on the South Texas College KPI webpage. According to the data, over the past five years, an increasing number of students have been receiving credit for courses they have attempted. Data on the percentage of students who complete courses, the percentage of students who withdraw…arrow_forwardA. Refer to the data and solve for the required measures of position. The following are the grades of 25 students in the first marking period of their Calculus I class. 65, 68, 70, 71, 73, 75, 75, 76, 78, 78, 79, 80, 83, 85, 87, 88, 89, 90, 90, 91, 93, 94, 95, 95, 97arrow_forward
- please don't provide hand writtin solution...arrow_forwardQ.2) A manager at the delivery company recorded the mean and median delivery cost, but unfortunately lost the paper on which the values were recorded. However, the manager can remember that one value was about $4.00 and the other was about $4.40. Which value is the mean and which is the median? i. $4.00 is the mean and $4.40 is the median. ii. ii. $4.40 is the mean and $4.00 is the median. iii. It's impossible to tell which is which. 111. Q.3) Which of the following sets of four numbers has the largest standard deviation? (а) 100, 101, 102, 103 (b) 7, 8, 9, 10 (с) 5, 5, 5, 5 (d) 0, 1, 2, 3 (e) 0, 0, 10, 10arrow_forwardFor each vignette, choose the type of research that is being conducted. There is only one correct answer for each vignette. Here are your answer choices for questions 1-18 Case Study Naturalistic Observation Laboratory Observation Survey Correlation Test Experiment Longitudinal Design Cross Section Cross Sequential Design Maria wants to understand the political demographics in her community, so she creates a questionnaire asking people to identify their age, gender, political affiliation, religion and marital status. After Maria collects the abovementioned data (in question #12), she then identifies the relationships between religion and political affiliation. Kathi…arrow_forward
arrow_back_ios
SEE MORE QUESTIONS
arrow_forward_ios
Recommended textbooks for you
- MATLAB: An Introduction with ApplicationsStatisticsISBN:9781119256830Author:Amos GilatPublisher:John Wiley & Sons Inc
 Probability and Statistics for Engineering and th...StatisticsISBN:9781305251809Author:Jay L. DevorePublisher:Cengage Learning
 Statistics for The Behavioral Sciences (MindTap C...StatisticsISBN:9781305504912Author:Frederick J Gravetter, Larry B. WallnauPublisher:Cengage Learning
  Elementary Statistics: Picturing the World (7th E...StatisticsISBN:9780134683416Author:Ron Larson, Betsy FarberPublisher:PEARSON
 The Basic Practice of StatisticsStatisticsISBN:9781319042578Author:David S. Moore, William I. Notz, Michael A. FlignerPublisher:W. H. Freeman
 Introduction to the Practice of StatisticsStatisticsISBN:9781319013387Author:David S. Moore, George P. McCabe, Bruce A. CraigPublisher:W. H. Freeman
MATLAB: An Introduction with Applications
Statistics
ISBN:9781119256830
Author:Amos Gilat
Publisher:John Wiley & Sons Inc
Probability and Statistics for Engineering and th...
Statistics
ISBN:9781305251809
Author:Jay L. Devore
Publisher:Cengage Learning
Statistics for The Behavioral Sciences (MindTap C...
Statistics
ISBN:9781305504912
Author:Frederick J Gravetter, Larry B. Wallnau
Publisher:Cengage Learning
Elementary Statistics: Picturing the World (7th E...
Statistics
ISBN:9780134683416
Author:Ron Larson, Betsy Farber
Publisher:PEARSON
The Basic Practice of Statistics
Statistics
ISBN:9781319042578
Author:David S. Moore, William I. Notz, Michael A. Fligner
Publisher:W. H. Freeman
Introduction to the Practice of Statistics
Statistics
ISBN:9781319013387
Author:David S. Moore, George P. McCabe, Bruce A. Craig
Publisher:W. H. Freeman