FINANCIAL ACCOUNTING
10th Edition
ISBN: 9781259964947
Author: Libby
Publisher: MCG
expand_more
expand_more
format_list_bulleted
Concept explainers
Topic Video
Question

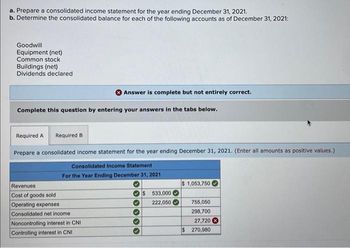
Transcribed Image Text:a. Prepare a consolidated income statement for the year ending December 31, 2021.
b. Determine the consolidated balance for each of the following accounts as of December 31, 2021:
Goodwill
Equipment (net)
Common stock
Buildings (net)
Dividends declared
Complete this question by entering your answers in the tabs below.
Answer is complete but not entirely correct.
Required A Required B
Prepare a consolidated income statement for the year ending December 31, 2021. (Enter all amounts as positive values.)
Consolidated Income Statement
For the Year Ending December 31, 2021
Revenues
Cost of goods sold
Operating expenses
Consolidated net income
Noncontrolling interest in CNI
Controlling interest in CNI
$ 533,000
222,050
$1,053,750
755,050
298,700
27,720
$ 270,980

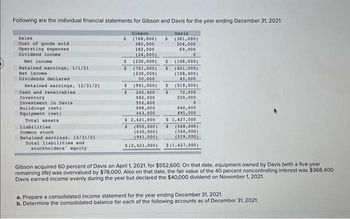
Transcribed Image Text:Following are the individual financial statements for Gibson and Davis for the year ending December 31, 2021:
Davis
(381,000)
204,000
69,000
0
Sales
Cost of goods sold
Operating expenses
Dividend income
Net income
Retained earnings, 1/1/21
Net income
Dividends declared
Retained earnings, 12/31/21
Cash and receivables.
Inventory
Investment in Davis
Buildings (net)
Equipment (net)
Total assets.
Liabilities
Common stock
Retained earnings, 12/31/21
Total liabilities and
stockholders' equity
Gibson
$ (768,000) $
380,000
182,000
(24,000)
$ (230,000) $ (108,000)
(451,000)
(108,000)
40,000
(519,000)
72,000
220,000
$ (761,000) $
(230,000)
50,000
$
$
(941,000) $
$
245,400
582,000
552,600
598,000
443,000
0
640,000
495,000
$1,427,000
(568,000)
(340,000)
(519,000)
$(1,427,000)
$ 2,421,000
$ (850,000) $
(630,000)
(941,000)
$(2,421,000)
Gibson acquired 60 percent of Davis on April 1, 2021, for $552,600. On that date, equipment owned by Davis (with a five-year
remaining life) was overvalued by $78,000. Also on that date, the fair value of the 40 percent noncontrolling interest was $368,400.
Davis earned income evenly during the year but declared the $40,000 dividend on November 1, 2021.
a. Prepare a consolidated income statement for the year ending December 31, 2021.
b. Determine the consolidated balance for each of the following accounts as of December 31, 2021:
Expert Solution
This question has been solved!
Explore an expertly crafted, step-by-step solution for a thorough understanding of key concepts.
Step by stepSolved in 4 steps with 1 images

Knowledge Booster
Learn more about
Need a deep-dive on the concept behind this application? Look no further. Learn more about this topic, accounting and related others by exploring similar questions and additional content below.Similar questions
- Revenue and expense data for the current calendar year for Sorenson Electronics Company and for the electronics industry are as follows. Sorenson Electronics Company data are expressed In dollars. The electronics Industry averages are expressed In percentages. Sorenson Electronics Electronics Industry Company Average Sales $870,000 100 % Cost of goods sold (504,600) (64) Gross profit $365,400 36 % Selling expenses $(217,500) (15) % Administrative expenses (87,000) (15) Total operating expenses $(304,500) (30) % Operating Income $60,900 6 % Other revenue and expense: Other revenue 17,400 Other expense (8,700) (3) Income before Income tax $69,600 7 % Income tax expense (26,100) (4) Net Income $43,500 3 % a. Prepare a common-sized Income statement comparing the results of operations for Sorenson Electronics Company with the Industry average. If required, round percentages to one decimal place. Sorenson Electronics Company Common-Sized Income Statement Sorenson Electronics Sorenson…arrow_forwardThe following items were taken from the financial statements of Kramer Manufacturing, Inc., over a 3-year period: Item 2021 2020 2019 Net sales $226,000 $212,000 $200,000 Cost of goods sold 150,000 140,000 125,000 Gross profit $ 76,000 $ 72,000 $ 75,000 Instructions Using horizontal analysis and 2019 as the base year, compute the trend percentages for net sales, cost of goods sold, and gross profit. Item 2021 2020 2019 Net sales % % 100% Cost of goods sold % % 100% Gross profit % % 100% Explain whether the trends are favorable or unfavorable for each…arrow_forwardHere are comparative financial statement data for Sandhill Company and Wildhorse Company, two competitors. All data are as of December 31, 2022, and December 31, 2021. Sandhill Company Wildhorse Company 2022 2021 2022 2021 Net sales $1,872,000 $559,000 Cost of goods sold 1,100,736 297,388 Operating expenses 263,952 79,378 Interest expense 9,360 4,472 Income tax expense 54,288 6,149 Current assets 326,000 $314,500 83,500 $78,600 Plant assets (net) 519,600 497,900 141,000 125,100 Current liabilities 66,000 75,800 36,600 29,800 Long-term liabilities 107,800 91,600 30,400 25,600 Common stock, $10 par 498,000 498,000 122,500 122,500 Retained earnings 173,800 147,000 35,000 25,800 (a) Prepare a vertical analysis of the 2022 income statement data for Sandhill Company and Wildhorse Company. (Round percentages…arrow_forward
- The following condensed income statements of the Jackson Holding Company are presented for the two years ended December 31, 2021 and 2020: 2021 2020 Sales revenue $ 15,000,000 $ 9,600,000 Cost of goods sold 9,200,000 6,000,000 Gross profit 5,800,000 3,600,000 Operating expenses 3,200,000 2,600,000 Operating income 2,600,000 1,000,000 Gain on sale of division 600,000 — 3,200,000 1,000,000 Income tax expense 800,000 250,000 Net income $ 2,400,000 $ 750,000 On October 15, 2021, Jackson entered into a tentative agreement to sell the assets of one of its divisions. The division qualifies as a component of an entity as defined by GAAP. The division was sold on December 31, 2021, for $5,000,000. Book value of the division’s assets was $4,400,000. The division’s contribution to Jackson’s operating income before-tax for each year was as follows: 2021 $400,000 2020 $300,000 Assume…arrow_forwardThe following information is available for Skysong Corp. for the year ended December 31, 2025. Other revenues and gains $21,600 Other expenses and losses 3,000 Cost of goods sold 281,000 Sales discounts 3,200 Sales revenue 746,000 Operating expenses 210,000 Sales returns and allowances 8,800 Prepare a multiple-step income statement for Skysong Corp. The company has a tax rate of 25%.arrow_forwardIn its income statement for the year ended December 31, 2022, Pharoah Company reported the following condensed data. Operating expenses Cost of goods sold Interest expense (a) (b) Prepare a single-step income statement. Revenues $776,000 1,236,000 72,000 Net Sales Interest revenue Loss on disposal of plant assets Net sales Pharoah Company Income Statement For the Year Ended December 31, 2022 69 $ 29,000 17,000 2,218,000 KNUTarrow_forward
- The following information is available for Tamarisk Corp. for the year ended December 31, 2022. Other revenues and gains $23,800 Other expenses and losses 4,000 Cost of goods sold 292,000 Sales discounts 4,600 Sales revenue 760,000 Operating expenses 221,000 Sales returns and allowances 10,800 Prepare a multiple-step income statement for Tamarisk Corp. The company has a tax rate of 25%.arrow_forwardA company reported the following data for the year ending 2018: Description Amount Sales $400,000 Sales discount $16,000 Sales returns and allowances $13.000 Cost of goods sold $117,000 Operating expense $153,000 Income tax expense $23,750 Compute the amount of net sales to be reported on the Income statement. $371,000 $397000 $384.000 $387.000arrow_forwardRussell Department Stores, Inc. Income Statement Compared with Industry Average Year Ended December 31, 2018 Russell Industry Average Net sales revenue $780,000 100.0 % Cost of goods sold 524,940 65.8 Gross Profit 255,060 34.2 Operating Expenses 162,240 19.7 Operating Income 92,820 14.5 Other Expenses 7,800 0.4 Net Income 85,020 14.1 % MORE INFO: Russell/industry average Total Assets $480,000 100.0 % total Liabilities 327,360 64.7 total Liabilities and Stockholders' Equity $480,000 100.0 % SOLVE for % of total (round total to one decimal place x.x%) Amount Percent of total Net Sales Revenue 780,000 Cost of goods sold 524,940 gross profit 255,060 operating expenses 162240 operating income 92820 other expenses 7800arrow_forward
- Portions of the financial statements for Alliance Technologies are provided below. ALLIANCE TECHNOLOGIES Income Statement For the year ended December 31, 2021 Net sales Expenses: Cost of goods sold Operating expenses Depreciation expense Income tax expense $365,000 $215,000 66,000 16,600 25,000 322,600 $ 42,400 Total expenses Net income ALLIANCE TECHNOLOGIES Selected Balance Sheet Data December 31, 2021, compared to December 31, 2020 $ 6,600 13,600 9,600 5,600 8,600 22,400 Decrease in accounts receivable Increase in inventory Decrease in prepaid rent Increase in salaries payable Decrease in accounts payable Increase in income tax payable Required: Prepare the operating activities section of the statement of cash flows for Alliance Technologies using the indirect method. (List cash outflows and any decrease in cash as negative amounts.)arrow_forwardAssume that the Acct 201 Co. has $1,000,000 in Sales ($600,000 on account; $400,000 for cash), Cost of merchandise sold of $100,000 and Operating expenses of $300,000. Acct 201's Gross profit is:arrow_forwardPortions of the financial statements for Peach Computer are provided below. Net sales Expenses: PEACH COMPUTER Income Statement For the year ended December 31, 2024 Cost of goods sold Operating expenses Depreciation expense Income tax expense Total expenses Net income Cash Accounts receivable Inventory Prepaid rent Accounts payable Income tax payable PEACH COMPUTER Selected Balance Sheet Data December 31 2024 $106,000 45,400 79,000 3,400 $1,090,000 600,000 54,000 44,000 49,000 5,400 2023 $87,000 51,000 57,000 5,800 39,000 12,000 $1,900,000 1,788,000 $112,000 Increase (I) or Decrease (D) $19,000 (I) 5,600 (D) 22,000 (I) 2,400 (D) 10,000 (I) 6,600 (D) Required: Prepare the operating activities section of the statement of cash flows for Peach Computer using the direct method. (Amounts to be deducted should be indicated with a minus sign.)arrow_forward
arrow_back_ios
SEE MORE QUESTIONS
arrow_forward_ios
Recommended textbooks for you

 AccountingAccountingISBN:9781337272094Author:WARREN, Carl S., Reeve, James M., Duchac, Jonathan E.Publisher:Cengage Learning,
 Accounting Information SystemsAccountingISBN:9781337619202Author:Hall, James A.Publisher:Cengage Learning,
 Horngren's Cost Accounting: A Managerial Emphasis...AccountingISBN:9780134475585Author:Srikant M. Datar, Madhav V. RajanPublisher:PEARSON
 Intermediate AccountingAccountingISBN:9781259722660Author:J. David Spiceland, Mark W. Nelson, Wayne M ThomasPublisher:McGraw-Hill Education
 Financial and Managerial AccountingAccountingISBN:9781259726705Author:John J Wild, Ken W. Shaw, Barbara Chiappetta Fundamental Accounting PrinciplesPublisher:McGraw-Hill Education


Accounting
Accounting
ISBN:9781337272094
Author:WARREN, Carl S., Reeve, James M., Duchac, Jonathan E.
Publisher:Cengage Learning,

Accounting Information Systems
Accounting
ISBN:9781337619202
Author:Hall, James A.
Publisher:Cengage Learning,

Horngren's Cost Accounting: A Managerial Emphasis...
Accounting
ISBN:9780134475585
Author:Srikant M. Datar, Madhav V. Rajan
Publisher:PEARSON

Intermediate Accounting
Accounting
ISBN:9781259722660
Author:J. David Spiceland, Mark W. Nelson, Wayne M Thomas
Publisher:McGraw-Hill Education

Financial and Managerial Accounting
Accounting
ISBN:9781259726705
Author:John J Wild, Ken W. Shaw, Barbara Chiappetta Fundamental Accounting Principles
Publisher:McGraw-Hill Education