
MATLAB: An Introduction with Applications
6th Edition
ISBN: 9781119256830
Author: Amos Gilat
Publisher: John Wiley & Sons Inc
expand_more
expand_more
format_list_bulleted
Related questions
Concept explainers
Topic Video
Question
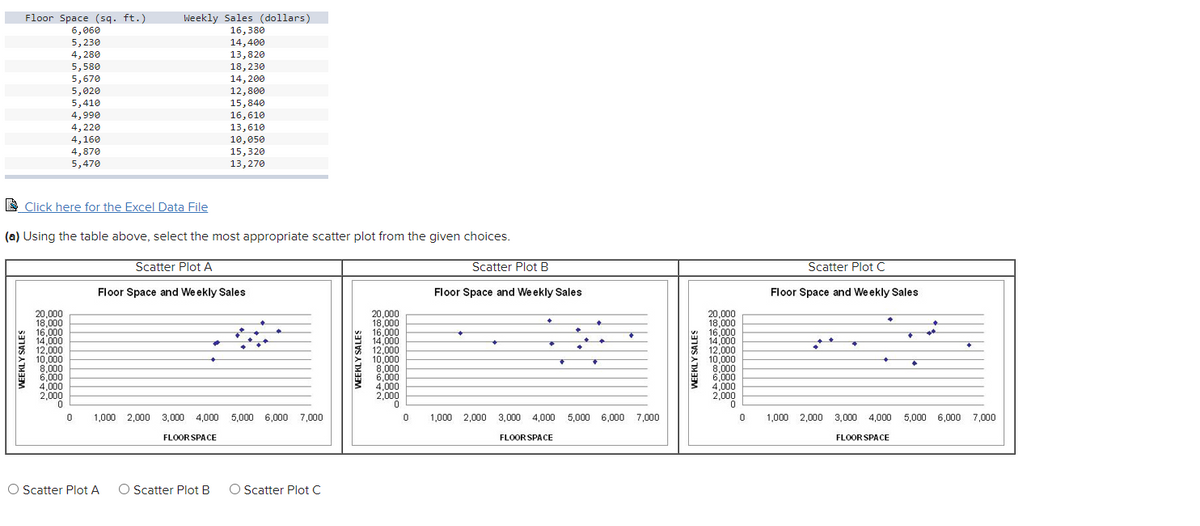

Transcribed Image Text:Floor Space (sq. ft.)
6,060
5,230
4, 280
5,580
Weekly Sales (dollars)
16,380
14,400
13,820
18,230
5,670
5,020
5,410
4,990
14, 200
12,800
15,840
16,610
13,610
10,050
15,320
4,220
4,160
4,870
5,470
13,270
E Click here for the Excel Data File
(a) Using the table above, select the most appropriate scatter plot from the given choices.
Scatter Plot A
Scatter Plot B
Scatter Plot C
Floor Space and We ekly Sales
Floor Space and We ekly Sales
Floor Space and We ekly Sales
20,000
18,000
16,000
14,000
* 12,000
10,000
8,000
6,000
4,000
2,000
20,000
18,000
16,000
14,000
* 12,000
10,000
8,000
6,000
4,000
2,000
20,000
18,000
16,000
14,000
* 12,000
10,000
8,000
6,000
4,000
2,000
1,000 2,000 3,000 4,000 5,000 6,000 7,000
1,000 2,000 3,000 4,000 5,000 6,000 7,000
1,000 2,000 3,000 4,000
5,000 6,000 7,000
FLOOR SPACE
FLOOR SPACE
FLOOR SPACE
O Scatter Plot A
Scatter Plot B
O Scatter Plot C
WEEKLY SALES
WEEKLY SALES
WEEKLY SALES

Transcribed Image Text:(a) Using the table above, select the most appropriate scatter plot from the given choices.
Scatter Plot A
Scatter Plot B
Scatter Plot C
Floor Space and We ekly Sales
Floor Space and We ekly Sales
Floor Space and We ekly Sales
20,000
18,000
16,000
14,000
* 12,000
10,000
8,000
6,000
4,000
2,000
20,000
18,000
16,000
14,000
* 12,000
10,000
8,000
6,000
4,000
2,000
20,000
18,000
16,000
14,000
* 12,000
10.000
8,000
6,000
4,000
2,000
1,000 2,000 3,000 4,000 5,000 6,000 7,000
1,000 2,000
3,000 4,000
5,000 6,000 7,000
1,000 2,000 3,000 4,000 5,000 6,000 7,000
FLOOR SPACE
FLOOR SPACE
FLOOR SPACE
O Scatter Plot A
O Scatter Plot B
O Scatter Plot C
(b) Define the relationship between Xand Y. (You may select more than one answer. Click the box with a check mark for the correct
answer and double click to empty the box for the wrong answer.)
2 Negative
2 Strong
? Positive
? Moderate
? Nonlinear
? Linear
WEEKLY SALES
WEEKLY SALES
WEEKLY SALES
Expert Solution
This question has been solved!
Explore an expertly crafted, step-by-step solution for a thorough understanding of key concepts.

This is a popular solution

Trending nowThis is a popular solution!

Step by stepSolved in 3 steps with 1 images

Knowledge Booster


Learn more about
Need a deep-dive on the concept behind this application? Look no further. Learn more about this topic, statistics and related others by exploring similar questions and additional content below.Similar questions
- The total amount of consumer credit has been increasing steadily in recent years. The following table gives the total outstanding consumer credit (in billions of dollars). Answer parts (a) through (e) below Year 2004 2005 2006 2007 2008 Consumer Credit 2250.5 2303.8 2415.0 2517.9 2595.1 Year 2009 2010 2011 2012 2013 Consumer Credit 2551.5 2645.1 2757.0 2926 3 3099 2 a. Find an equation for the least squares line, letting x equal the number of years since 2000. The equation is Y=x (Use integers or decimals for any numbers in the equation Round to two decimal places as needed.)arrow_forwardPlease give the excel formula or spreadsheet.arrow_forwardAnswer the following questions regarding the population of Hamilton County in 2016. a. If you predict the population of Hamilton County in 2016, should you use the average growth rate of 2000-2009 or the average growth rate of 2009-2015? Explain your choice in a complete sentence. b. Predict the population of Hamilton Country in 2016. Show your work. Express your answer in “thousand people” rounded to the nearest whole number.arrow_forward
arrow_back_ios
arrow_forward_ios
Recommended textbooks for you
- MATLAB: An Introduction with ApplicationsStatisticsISBN:9781119256830Author:Amos GilatPublisher:John Wiley & Sons Inc
 Probability and Statistics for Engineering and th...StatisticsISBN:9781305251809Author:Jay L. DevorePublisher:Cengage Learning
 Statistics for The Behavioral Sciences (MindTap C...StatisticsISBN:9781305504912Author:Frederick J Gravetter, Larry B. WallnauPublisher:Cengage Learning
  Elementary Statistics: Picturing the World (7th E...StatisticsISBN:9780134683416Author:Ron Larson, Betsy FarberPublisher:PEARSON
 The Basic Practice of StatisticsStatisticsISBN:9781319042578Author:David S. Moore, William I. Notz, Michael A. FlignerPublisher:W. H. Freeman
 Introduction to the Practice of StatisticsStatisticsISBN:9781319013387Author:David S. Moore, George P. McCabe, Bruce A. CraigPublisher:W. H. Freeman
MATLAB: An Introduction with Applications
Statistics
ISBN:9781119256830
Author:Amos Gilat
Publisher:John Wiley & Sons Inc
Probability and Statistics for Engineering and th...
Statistics
ISBN:9781305251809
Author:Jay L. Devore
Publisher:Cengage Learning
Statistics for The Behavioral Sciences (MindTap C...
Statistics
ISBN:9781305504912
Author:Frederick J Gravetter, Larry B. Wallnau
Publisher:Cengage Learning
Elementary Statistics: Picturing the World (7th E...
Statistics
ISBN:9780134683416
Author:Ron Larson, Betsy Farber
Publisher:PEARSON
The Basic Practice of Statistics
Statistics
ISBN:9781319042578
Author:David S. Moore, William I. Notz, Michael A. Fligner
Publisher:W. H. Freeman
Introduction to the Practice of Statistics
Statistics
ISBN:9781319013387
Author:David S. Moore, George P. McCabe, Bruce A. Craig
Publisher:W. H. Freeman