Finish time (minutes) 0 to less than 1(0 10 to less than 20 20 to less than 30 30 to less than 40 40 to less than 50 Numberof athletes 3 10 6 4 2


Inverse Normal Distribution
The method used for finding the corresponding z-critical value in a normal distribution using the known probability is said to be an inverse normal distribution. The inverse normal distribution is a continuous probability distribution with a family of two parameters.
Mean, Median, Mode
It is a descriptive summary of a data set. It can be defined by using some of the measures. The central tendencies do not provide information regarding individual data from the dataset. However, they give a summary of the data set. The central tendency or measure of central tendency is a central or typical value for a probability distribution.
Z-Scores
A z-score is a unit of measurement used in statistics to describe the position of a raw score in terms of its distance from the mean, measured with reference to standard deviation from the mean. Z-scores are useful in statistics because they allow comparison between two scores that belong to different normal distributions.
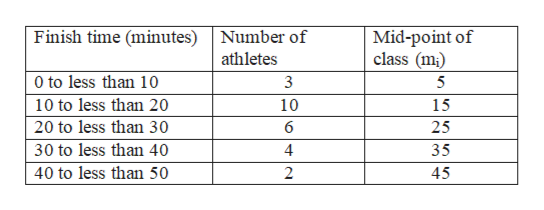
25 athletes participate in a race and all of them finish it. The distribution of times taken to complete the race by athletes (in minutes) is shown in the table below. Calculate the

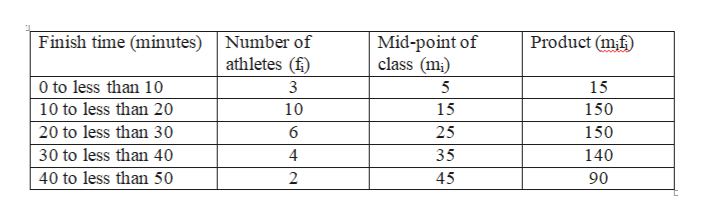
This is a problem on finding the mean of continuous grouped data. We first find the midpoint of each interval. For example, the first interval or class is 0 - 10. The mid-point of this class will be (0 + 10)/2 = 5.
We now calculate the product of mid-point and frequency for each class. Here, the number of athletes in each class is the frequency of that class. For example, for the first class 0 – 10, its frequency is 3.

Trending now
This is a popular solution!

Step by step
Solved in 4 steps with 3 images

Suppose another researcher takes a random sample of 1000 subjects from the same population (US physicians who received payments from any of 8 major pharmaceutical companies in 2011). You have not yet seen these data. Likely, how will the sample standard deviation of these 1000 values (s1000) compare to the sample standard deviation of individual physician payments in the sample of 400 (s400=17 )


