MATLAB: An Introduction with Applications
6th Edition
ISBN: 9781119256830
Author: Amos Gilat
Publisher: John Wiley & Sons Inc
expand_more
expand_more
format_list_bulleted
Question

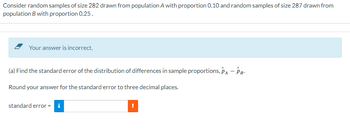
Transcribed Image Text:Consider random samples of size 282 drawn from population A with proportion 0.10 and random samples of size 287 drawn from
population B with proportion 0.25.
Your answer is incorrect.
(a) Find the standard error of the distribution of differences in sample proportions, PA - PB.
Round your answer for the standard error to three decimal places.
standard error = i
Expert Solution
This question has been solved!
Explore an expertly crafted, step-by-step solution for a thorough understanding of key concepts.
This is a popular solution
Trending nowThis is a popular solution!
Step by stepSolved in 3 steps with 1 images

Knowledge Booster
Similar questions
- Ch 8 FRQ ( The distribution of average speeds of the top 53 drivers in NASCAR is roughly symmetric, unimodal, and bell-shaped, with a mean of 184.8 mph and a standard deviation of 7.2 mph. In the space above, draw a Normal Curve, from z=-3 to z=+3. Draw vertical lines at the mean and each whole number standard deviation above and below the mean. Write two rows of numbers under the base line; one row with the number of standard deviations above and below the mean (z-scores), and a row under that with the actual values for this problem. ] What percent of drivers would you expect to have speeds below 199.2 mph ? Show all work. s] What is the area under the curve to the left of a speed of 170.4mph Show all work. What is the probability that a driver selected at random will have a speed below 172.0 mph ? Show all work. B] What percent of drivers would you expect to have a speed above 177.0 mph ? Show all work. How many drivers would you expect to have speeds between 170.4 mph and 177.0 mph…arrow_forwardThe coefficient of variation CV describes the standard deviation as a percent of the mean. Because it has no units, you can use the coefficient of variation to compare data with different units. Find the coefficient of variation for each sample data set. What can you conclude? Standard deviation CV = • 100% Mean E Click the icon to view the data sets. Data Table C/heights = 5.0 % (Round to the nearest tenth as needed.) Heights Weights CVweights =% (Round to the nearest tenth as needed.) 68 181 77 169 72 167 72 207 71 177 70 175 78 185 69 186 67 221 70 216 67 209 73 206arrow_forwardThe first pic is the question. Since some tutors have been solving the problems wrong recently (no judgment), I’ve added a sample question to solve problem.arrow_forward
- Find the estimated standard error for the sample mean for n = 13 and SS = 3639. Nearest hundredths place.arrow_forwardYou roll 36 dice over and over. what is standard error of sampling distribution of x-bar (the mean)?arrow_forwardWhen reporting the results of mean difference tests, should be used. Group of answer choices stacked charts tables scatterplots pie chartsarrow_forward
- Can someone please help? Thank you.arrow_forward☐True ☐False The difference between the sample and the population being estimated is called the sampling errorarrow_forwarded in in the table 2. Find the mean, median, and mode for the following sample of scores: one person the sample 12. A sample One persoi 5 4 5 2 7 1 3 5 ust use the s found stribution nidpoint of students edian, you ates the highest quency. epresen-arrow_forward
- A simple random sample of 736 photographers found that 65% plan to purchase new equipment within the next year. Data follows the normal curve. What is the SD of the sample? Round to three decimal places. Typed and correct answer please. I ll rate accordingly.arrow_forwardq9- The sum of squared deviations from the sample mean of a sample of 10 observations is 267. What is variance of the sample? a. 23.73 b. 35.60 c. 59.33 d. 29.67arrow_forward
arrow_back_ios
arrow_forward_ios
Recommended textbooks for you
 MATLAB: An Introduction with ApplicationsStatisticsISBN:9781119256830Author:Amos GilatPublisher:John Wiley & Sons Inc
 Probability and Statistics for Engineering and th...StatisticsISBN:9781305251809Author:Jay L. DevorePublisher:Cengage Learning
 Statistics for The Behavioral Sciences (MindTap C...StatisticsISBN:9781305504912Author:Frederick J Gravetter, Larry B. WallnauPublisher:Cengage Learning
 Elementary Statistics: Picturing the World (7th E...StatisticsISBN:9780134683416Author:Ron Larson, Betsy FarberPublisher:PEARSON
 The Basic Practice of StatisticsStatisticsISBN:9781319042578Author:David S. Moore, William I. Notz, Michael A. FlignerPublisher:W. H. Freeman
 Introduction to the Practice of StatisticsStatisticsISBN:9781319013387Author:David S. Moore, George P. McCabe, Bruce A. CraigPublisher:W. H. Freeman

MATLAB: An Introduction with Applications
Statistics
ISBN:9781119256830
Author:Amos Gilat
Publisher:John Wiley & Sons Inc

Probability and Statistics for Engineering and th...
Statistics
ISBN:9781305251809
Author:Jay L. Devore
Publisher:Cengage Learning

Statistics for The Behavioral Sciences (MindTap C...
Statistics
ISBN:9781305504912
Author:Frederick J Gravetter, Larry B. Wallnau
Publisher:Cengage Learning

Elementary Statistics: Picturing the World (7th E...
Statistics
ISBN:9780134683416
Author:Ron Larson, Betsy Farber
Publisher:PEARSON

The Basic Practice of Statistics
Statistics
ISBN:9781319042578
Author:David S. Moore, William I. Notz, Michael A. Fligner
Publisher:W. H. Freeman

Introduction to the Practice of Statistics
Statistics
ISBN:9781319013387
Author:David S. Moore, George P. McCabe, Bruce A. Craig
Publisher:W. H. Freeman