
A First Course in Probability (10th Edition)
10th Edition
ISBN: 9780134753119
Author: Sheldon Ross
Publisher: PEARSON
expand_more
expand_more
format_list_bulleted
Related questions
Concept explainers
Topic Video
Question
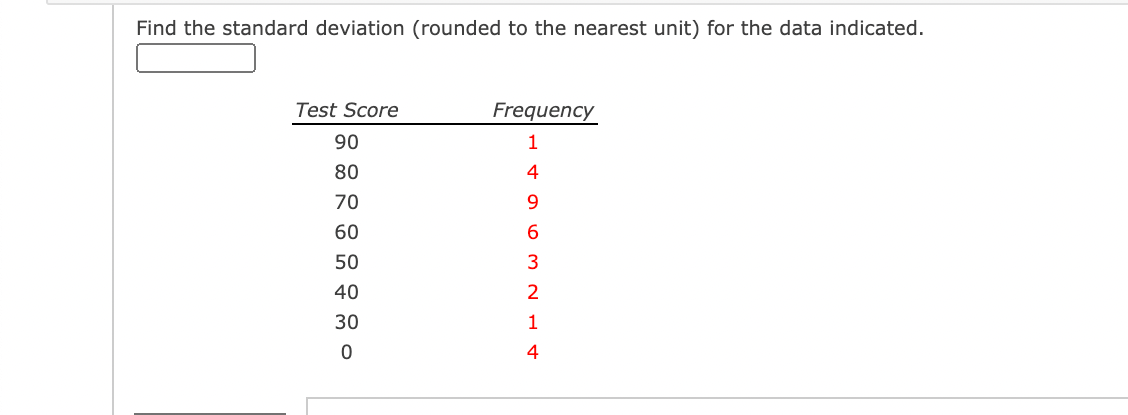

Transcribed Image Text:Find the standard deviation (rounded to the nearest unit) for the data indicated.
Test Score
Frequency
06
80
1
4
70
9.
60
50
3
40
2
30
1
4
Expert Solution
This question has been solved!
Explore an expertly crafted, step-by-step solution for a thorough understanding of key concepts.

Step by stepSolved in 2 steps with 2 images

Knowledge Booster


Learn more about
Need a deep-dive on the concept behind this application? Look no further. Learn more about this topic, probability and related others by exploring similar questions and additional content below.Similar questions
- Grades 50-60 60-70 70-80 80-90 90-100 No. of Students 9. Calculate the standard deviation of the sample grouped data above.arrow_forwardA sample of weights (in pounds) for six 12-year- olds is given below: 90 75 85 85 97 91 Find the range and standard deviation for this sample. Sample Range = Sample Standard Deviation = %3Darrow_forwardFind the standard deviation of the sample data below: 3,5,6,9 (Answer: 1 decimal place) Type your answer... Previousarrow_forward
- IQ scores are normally distributed with a mean of 100 and standard deviation 16. Calculate the z-score for an IQ of 76. Include one decimal place in your answer. Add your answerarrow_forwardFind the standard deviation (rounded to the nearest unit) for the data indicated. Test Score Frequency 90 1 80 4 70 8 60 5 50 3 40 2 30 1 0 4 Is there an easy way to get it?arrow_forwardFind the standard deviation (rounded to the nearest unit) for the data indicated. Test Score Frequency 90 1 80 4 70 7 60 6 50 3arrow_forward
- The grades for 30 students on the most recent exam are given in the data table below: Round your answer to 2 decimal places as needed 70 70 80 80 70 60 90 80 80 80 60 70 70 70 70 90 70 70 80 90 60 90 70 60 90 70 06 90 90 80 What is the mean score for the exam? What is the median score for the exam? What is the standard deviation for the exam?arrow_forwardFind the range and standard deviation of the following set of data. 168, 177, 163, 174, 167, 186, 162arrow_forwardFind the standard deviation for the following data.Round your answer to 2 decimal places as needed 31,72,84,25,100,18,90,51,47,87arrow_forward
- What is the standard deviation?arrow_forwardIn an Algebra class, the scores on a test are normally distributed. The middle 68% of the scores fall between 69 and 81. What are the mean and standard deviation for this data? Standard Normal Curve Mean: Standard Deviation:arrow_forwardThe average driver spends $39 at the gas station each week with a standard deviation of $11. Assuming that the amount a driver spends on gas follows a normal distribution; find the percentage of drivers who spend: 1. More than $67? 2. Less than $25? 3. Between $25 and $67arrow_forward
arrow_back_ios
arrow_forward_ios
Recommended textbooks for you
- A First Course in Probability (10th Edition)ProbabilityISBN:9780134753119Author:Sheldon RossPublisher:PEARSON

A First Course in Probability (10th Edition)
Probability
ISBN:9780134753119
Author:Sheldon Ross
Publisher:PEARSON