
MATLAB: An Introduction with Applications
6th Edition
ISBN: 9781119256830
Author: Amos Gilat
Publisher: John Wiley & Sons Inc
expand_more
expand_more
format_list_bulleted
Related questions
Concept explainers
Question
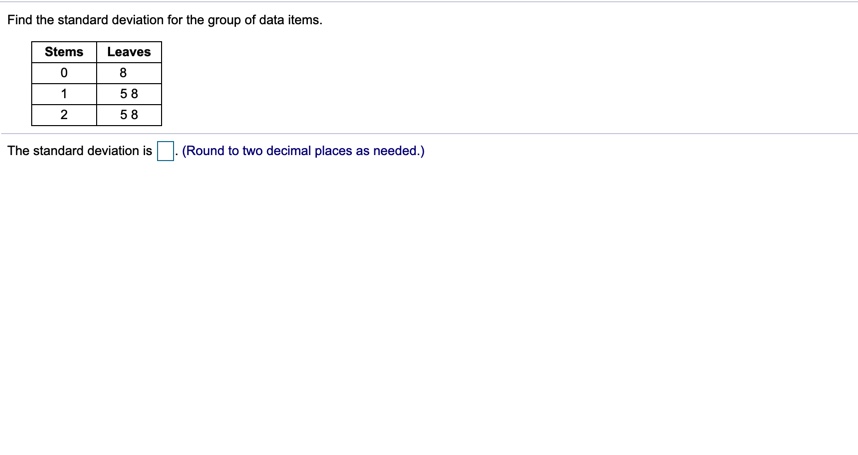

Transcribed Image Text:**Find the standard deviation for the group of data items.**
Below is a stem-and-leaf plot:
| Stems | Leaves |
|-------|--------|
| 0 | 8 |
| 1 | 5 8 |
| 2 | 5 8 |
**Explanation of the table:**
- The "Stems" column represents the leading digit(s) of each data point.
- The "Leaves" column lists the trailing digit(s) that complete the data values.
- Therefore, the data points are: 8, 15, 18, 25, and 28.
**Task:**
Calculate the standard deviation of these data points. \( \text{(Round to two decimal places as needed.)} \)
The standard deviation is \( \_\_\_ \).
Expert Solution
This question has been solved!
Explore an expertly crafted, step-by-step solution for a thorough understanding of key concepts.

This is a popular solution

Trending nowThis is a popular solution!

Step by stepSolved in 2 steps

Knowledge Booster


Learn more about
Need a deep-dive on the concept behind this application? Look no further. Learn more about this topic, statistics and related others by exploring similar questions and additional content below.Similar questions
- Find the range and the standard deviation (correct to two decimal places). 81, 91, 96, 96, 96 a) standard deviation =arrow_forwardFind the standard deviation for the group of data items. 5, 6, 7, 7, 8, 9 The standard deviation is (Simplify your answer. Round to two decimal places as needed.)arrow_forwardFind the range, the standard deviation, and the variance for the given samples. Round non-integer results to the nearest tenth. -29, -14, –10, –17, –4, –13, -26 range standard deviation variance Need Help? Watch Itarrow_forward
- The amount of caffeine in a sample of five-ounce servings of brewed coffee is shown in the histogram. Make a frequency distribution for the data. Then use the table to estimate the sample mean and the sample standard deviation of the data set. Click the icon to view the histogram. Complete the table. Round values to the nearest tenth as needed. Graph/chart f Midpoint x xf 70.5 Ay 30- 92.5 26 25- 114.5 136.5 20- 158.5 15- 12 Ef = Exf = 10- Find the mean of the data set. 5- X = (Round to the nearest tenth as needed.) 48.5 70.5 92.5 114.5 136.5 158.5 Complete the table. Round values to the nearest tenth as needed. Midpoint x (x-x)? (x-x)?f X-X 70.5 Print Done 92.5 114.5 136.5 158.5 (x-x)?r= ] ofarrow_forwardinstructor gives a 100-point examination in which the grades are normally distributed. The mean is 66 and the standard deviation is 5. If there are 5% A's and 5% F's, 15% B's and 15% D's, and 60% C's, find the scores that divide the distribution into those categories. Round the cutoff scores to the nearest whole number. Round intermediate z-value calculations to 2 decimal places. A:_- B: C: D: --- F: _-_arrow_forwardFind the range and standard deviation of the set of data. 3 7,8, 10, 12, 14 e The range is 11 (Simplify your answer.) The standard deviation is (Round the final answer to the nearest hundredth as needed. Round all intermediate values to the nearest hundredth as needed.)arrow_forward
- A. Population ? B. Population mean ? C. Median ? F. IQR ? G. Population standard deviation ?H. population variance ?arrow_forwardplease shows that stepsarrow_forwardThe numbers of courses taught per semester by a random sample of university professors are shown in the histogram. Make a frequency distribution for the data. Then use the table to estimate the sample mean and the sample standard deviation of the data set. Make a frequency distribution for the data. X 1 3 f Number of professors 25- 20- 15- 10- 4 20 23 15 1 2 3 4 Number of courses taught per semesterarrow_forward
arrow_back_ios
arrow_forward_ios
Recommended textbooks for you
- MATLAB: An Introduction with ApplicationsStatisticsISBN:9781119256830Author:Amos GilatPublisher:John Wiley & Sons Inc
 Probability and Statistics for Engineering and th...StatisticsISBN:9781305251809Author:Jay L. DevorePublisher:Cengage Learning
 Statistics for The Behavioral Sciences (MindTap C...StatisticsISBN:9781305504912Author:Frederick J Gravetter, Larry B. WallnauPublisher:Cengage Learning
  Elementary Statistics: Picturing the World (7th E...StatisticsISBN:9780134683416Author:Ron Larson, Betsy FarberPublisher:PEARSON
 The Basic Practice of StatisticsStatisticsISBN:9781319042578Author:David S. Moore, William I. Notz, Michael A. FlignerPublisher:W. H. Freeman
 Introduction to the Practice of StatisticsStatisticsISBN:9781319013387Author:David S. Moore, George P. McCabe, Bruce A. CraigPublisher:W. H. Freeman
MATLAB: An Introduction with Applications
Statistics
ISBN:9781119256830
Author:Amos Gilat
Publisher:John Wiley & Sons Inc
Probability and Statistics for Engineering and th...
Statistics
ISBN:9781305251809
Author:Jay L. Devore
Publisher:Cengage Learning
Statistics for The Behavioral Sciences (MindTap C...
Statistics
ISBN:9781305504912
Author:Frederick J Gravetter, Larry B. Wallnau
Publisher:Cengage Learning
Elementary Statistics: Picturing the World (7th E...
Statistics
ISBN:9780134683416
Author:Ron Larson, Betsy Farber
Publisher:PEARSON
The Basic Practice of Statistics
Statistics
ISBN:9781319042578
Author:David S. Moore, William I. Notz, Michael A. Fligner
Publisher:W. H. Freeman
Introduction to the Practice of Statistics
Statistics
ISBN:9781319013387
Author:David S. Moore, George P. McCabe, Bruce A. Craig
Publisher:W. H. Freeman