
MATLAB: An Introduction with Applications
6th Edition
ISBN: 9781119256830
Author: Amos Gilat
Publisher: John Wiley & Sons Inc
expand_more
expand_more
format_list_bulleted
Related questions
Concept explainers
Question
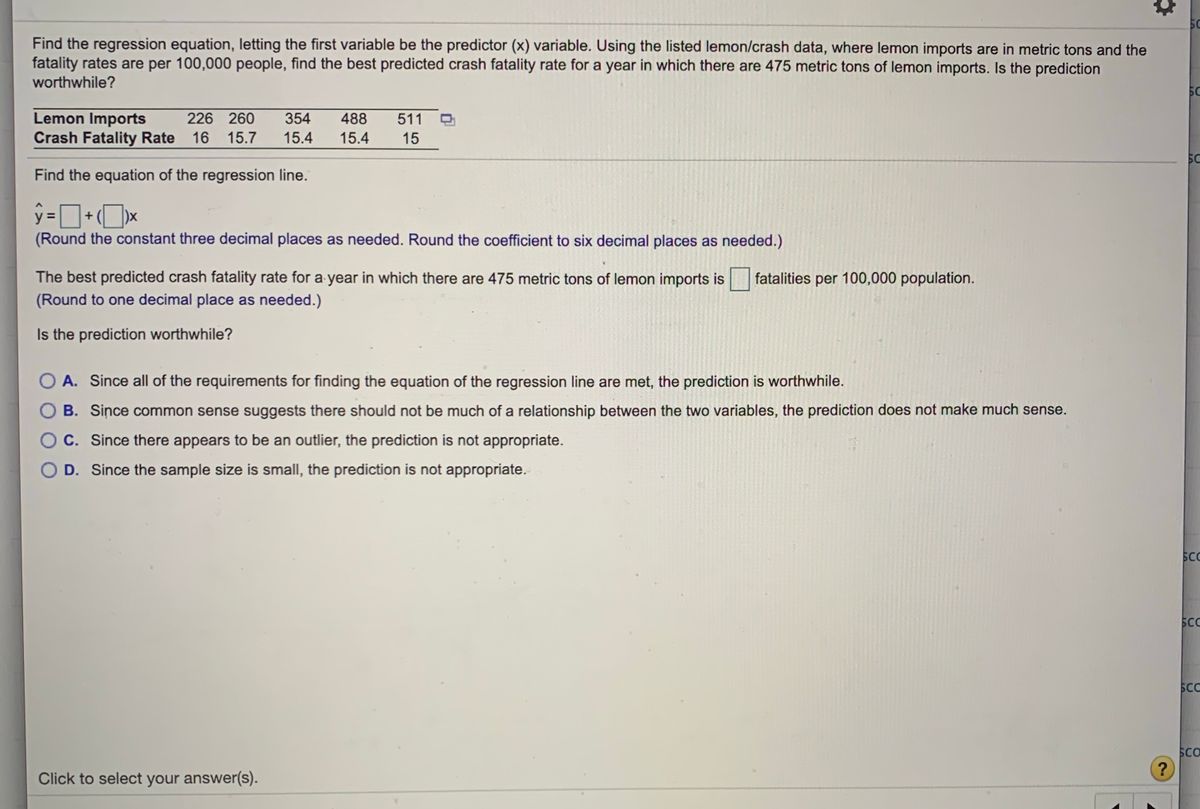

Transcribed Image Text:**Understanding Regression Analysis with Lemon Imports and Crash Fatality Rates**
**Task Explanation:**
The objective is to find the regression equation, using lemon imports as the predictor (x) variable. The data pairs lemon imports in metric tons and crash fatality rates per 100,000 people. The goal is to predict the crash fatality rate for a year with 475 metric tons of lemon imports, and assess if this prediction is worthwhile.
**Data Presented:**
- Lemon Imports (Metric Tons): 226, 260, 354, 488, 511
- Crash Fatality Rate (Per 100,000 People): 16, 15.7, 15.4, 15.4, 15
**Steps to Obtain the Regression Equation:**
1. **Find the Equation of the Regression Line:**
- Use the formula \(\hat{y} = a + bx\).
- \(a\) represents the y-intercept (round to three decimal places).
- \(b\) is the slope coefficient (round to six decimal places).
2. **Prediction for Given Data:**
- Determine the best predicted crash fatality rate when lemon imports are 475 metric tons (round to one decimal place).
3. **Evaluate Prediction Worth:**
- Options to consider regarding the prediction's validity:
- **A:** All regression line requirements met; prediction is worthwhile.
- **B:** Lack of logical relationship suggests prediction is nonsensical.
- **C:** Presence of an outlier makes prediction inappropriate.
- **D:** Small sample size renders prediction inappropriate.
**Conclusion:**
After inserting the required calculations, select the most reasonable answer regarding the prediction's worthiness.
Expert Solution
This question has been solved!
Explore an expertly crafted, step-by-step solution for a thorough understanding of key concepts.

This is a popular solution

Trending nowThis is a popular solution!

Step by stepSolved in 3 steps with 3 images

Knowledge Booster


Learn more about
Need a deep-dive on the concept behind this application? Look no further. Learn more about this topic, statistics and related others by exploring similar questions and additional content below.Similar questions
- Find the regression equation, letting the first variable be the predictor (x) variable. Using the listed lemon/crash data, where lemon imports are in metric tons and the fatality rates are per 100,000 people, find the best predicted crash fatality rate for a year in which there are 450 metric tons of lemon imports. Is the prediction worthwhile? Lemon Imports Crash Fatality Rate 230 262 364 480 519 16 15.7 15.4 15.3 14.9 ..... Find the equation of the regression line. y = + (Round the y-intercept to three decimal places as needed. Round the slope to four decimal places as needed.)arrow_forwardFind the regression equation, letting the first variable be the predictor (x) variable. Using the listed lemon/crash data, where lemon imports are in metric tons and the fatality rates are per 100,000 people, find the best predicted crash fatality rate for a year in which there are 425 metric tons of lemon imports. Is the prediction worthwhile? Lemon Imports Crash Fatality Rate 227 269 365 469 514 16 15.9 15.5 15.4 14.9 ..... Find the equation of the regression line. V = + (Round the y-intercept to three decimal places as needed. Round the slope to four decimal places as needed.)arrow_forwardFind the regression equation, letting the first variable be the predictor (x) variable. Using the listed lemon/crash data, where lemon imports are in metric tons and the fatality rates are per 100,000 people, find the best predicted crash fatality rate for a year in which there are 475 metric tons of lemon imports. Is the prediction worthwhile? Lemon Imports 231 262 354 500 536 Crash Fatality Rate 16 15.9 15.6 15.4 15arrow_forward
- Use the pizza cost and the subway fare in the table below to find the regression equation, letting pizza cost be the predictor (x) variable. (Pizza cost is in dollars per slice, subway fare and CPI are in dollars.) What is the best predicted subway fare when pizza costs $3.98 per slice? Year Pizza Cost Subway Fare CPI 1960 1973 1986 1995 2002 2003 2009 2013 2015 2019 0.152 0.353 1.000 1.251 1.753 2.003 2.254 2.300 2.747 2.997 0.151 0.346 1.000 1.347 1.497 2.004 2.253 2.551 2.747 2.750 29.6 44.4 109.6 152.4 180.0 184.0 214.5 233.0 237.0 252.2 The regression equation is y=+x. (Round the y-intercept to four decimal places as needed. Round the slope to three decimal places as needed.) The best predicted subway fare when pizza costs $3.98 per slice is $ (Round to the nearest cent as needed.)arrow_forwardFind the regression equation, letting the first variable be the predictor (x) variable. Using the listed lemon/crash data, where lemon imports are in metric tons and the fatality rates are per 100,000 people, find the best predicted crash fatality rate for a year in which there are 525 metric tons of lemon imports. Is the prediction worthwhile? Lemon Imports 232 264 361 467 537 Crash Fatality Rate 16 15.8 15.6 15.5 15 Find the equation of the regression line. y=nothing+(nothing)x (Round the constant three decimal places as needed. Round the coefficient to six decimal places as needed.) The best predicted crash fatality rate for a year in which there are 525 metric tons of lemon imports is nothing fatalities per 100,000 population. (Round to one decimal place as needed.) Is the prediction worthwhile? A. Since all of the requirements for finding the equation of the regression line are met, the prediction is…arrow_forwardThe best predicted crash fatality rate for a year in which there are 475 metric tons of lemon imports is fatalities per 100,000 population. (Round to one decimal place as needed.)arrow_forward
- Find the regression equation, letting the first variable be the predictor (x) variable. Using the sh data, where lemon imports are in metric tons and the fatality rates are per te, ouple, find the best predicted crash fatality rate for a year in which there are 450 metric tons of lemon imports. Is the prediction worthwhile? Question Viewer Lemon Imports 228 264 362 498 Crash Fatality Rate 16.1 16 15.8 15.5 526 15.1 Find the equation of the regression line. ŷ=+x (Round the y-intercept to three decimal places as needed. Round the slope to four decimal places as needed.)arrow_forwardFind the regression equation, letting the first variable be the predictor (x) variable. Using the listed lemon/crash data, where lemon imports are in metric tons and the fatality rates are per 100,000 people, find the best predicted crash fatality rate for a year in which there are 500 metric tons of lemon imports. Is the prediction worthwhile? Lemon Imports Crash Fatality Rate 15.9 15.7 225 261 357 492 529 O 14.9 15.3 15.4 Round the yntercept to three decimal places as needed. Round the stope to four decimal piaces as needed.) The best predicted crash fatality rate for a year in which there are 500 metric tons of lemon imports is fatalities per 100,000 population. (Round to one decimal place as needed.) Is the prediction worthwhile? O A. Since common sense suggests there should not be much of a relationship between the two variables, the prediction does not make much sense. O B. Since all of the requirements for finding the equation of the regression line are met, the prediction is…arrow_forwardThe data show the bug chirps per minute at different temperatures. Find the regression equation, letting the first variable be the independent (x) variable. Find the best predicted temperature for a time when a bug is chirping at the rate of 3000 chirps per minute. Use a significance level of 0.05. What is wrong with this predicted value? Chirps in 1 min 1118 796 1161 918 1103 1219 Temperature (F) 82 72.2 92.2 73 87.5 94.4arrow_forward
- Construct and interpret a 95% prediction interval for the proceeds when the number of issues is 658.arrow_forwardConstruct and interpret a 95% prediction interval for the proceeds when the number of issues is 602.arrow_forwardBelow table contains a data sample where X is the independent, and Y the dependent variable. Using the data, please conduct a regression analysis. Determine first the regression equation with the help of below graph and table, then answer all the questions. 1. The value of cell a is 2. The value of cell b is 3: The value of cell c is 4: The value of cell d is 5: The value of cell e is 6: The value of cell f is 7: The value of cell g is 8. The value of cell h is 9: The value of cell i is 10: The value of cell j is 11: The value of cell k is 12: The value of cell l is 13: The value of cell m is 14: The value of cell n is 15: The value of cell o is 16: The value of cell p is 17: The value of cell q is 18: The value of cell r is 19: The value of cell s is 20: The value of cell t is 21: The value of cell u is 22: The value of cell v is 23: The value of cell w is 24: The value of cell x is 25: The value of cell y is 26: The value of cell z is 27: The value of cell aa is 28: The value of cell…arrow_forward
arrow_back_ios
SEE MORE QUESTIONS
arrow_forward_ios
Recommended textbooks for you
- MATLAB: An Introduction with ApplicationsStatisticsISBN:9781119256830Author:Amos GilatPublisher:John Wiley & Sons Inc
 Probability and Statistics for Engineering and th...StatisticsISBN:9781305251809Author:Jay L. DevorePublisher:Cengage Learning
 Statistics for The Behavioral Sciences (MindTap C...StatisticsISBN:9781305504912Author:Frederick J Gravetter, Larry B. WallnauPublisher:Cengage Learning
  Elementary Statistics: Picturing the World (7th E...StatisticsISBN:9780134683416Author:Ron Larson, Betsy FarberPublisher:PEARSON
 The Basic Practice of StatisticsStatisticsISBN:9781319042578Author:David S. Moore, William I. Notz, Michael A. FlignerPublisher:W. H. Freeman
 Introduction to the Practice of StatisticsStatisticsISBN:9781319013387Author:David S. Moore, George P. McCabe, Bruce A. CraigPublisher:W. H. Freeman
MATLAB: An Introduction with Applications
Statistics
ISBN:9781119256830
Author:Amos Gilat
Publisher:John Wiley & Sons Inc
Probability and Statistics for Engineering and th...
Statistics
ISBN:9781305251809
Author:Jay L. Devore
Publisher:Cengage Learning
Statistics for The Behavioral Sciences (MindTap C...
Statistics
ISBN:9781305504912
Author:Frederick J Gravetter, Larry B. Wallnau
Publisher:Cengage Learning
Elementary Statistics: Picturing the World (7th E...
Statistics
ISBN:9780134683416
Author:Ron Larson, Betsy Farber
Publisher:PEARSON
The Basic Practice of Statistics
Statistics
ISBN:9781319042578
Author:David S. Moore, William I. Notz, Michael A. Fligner
Publisher:W. H. Freeman
Introduction to the Practice of Statistics
Statistics
ISBN:9781319013387
Author:David S. Moore, George P. McCabe, Bruce A. Craig
Publisher:W. H. Freeman