
MATLAB: An Introduction with Applications
6th Edition
ISBN: 9781119256830
Author: Amos Gilat
Publisher: John Wiley & Sons Inc
expand_more
expand_more
format_list_bulleted
Related questions
Concept explainers
Question
thumb_up100%

Transcribed Image Text:9687#/skip/4
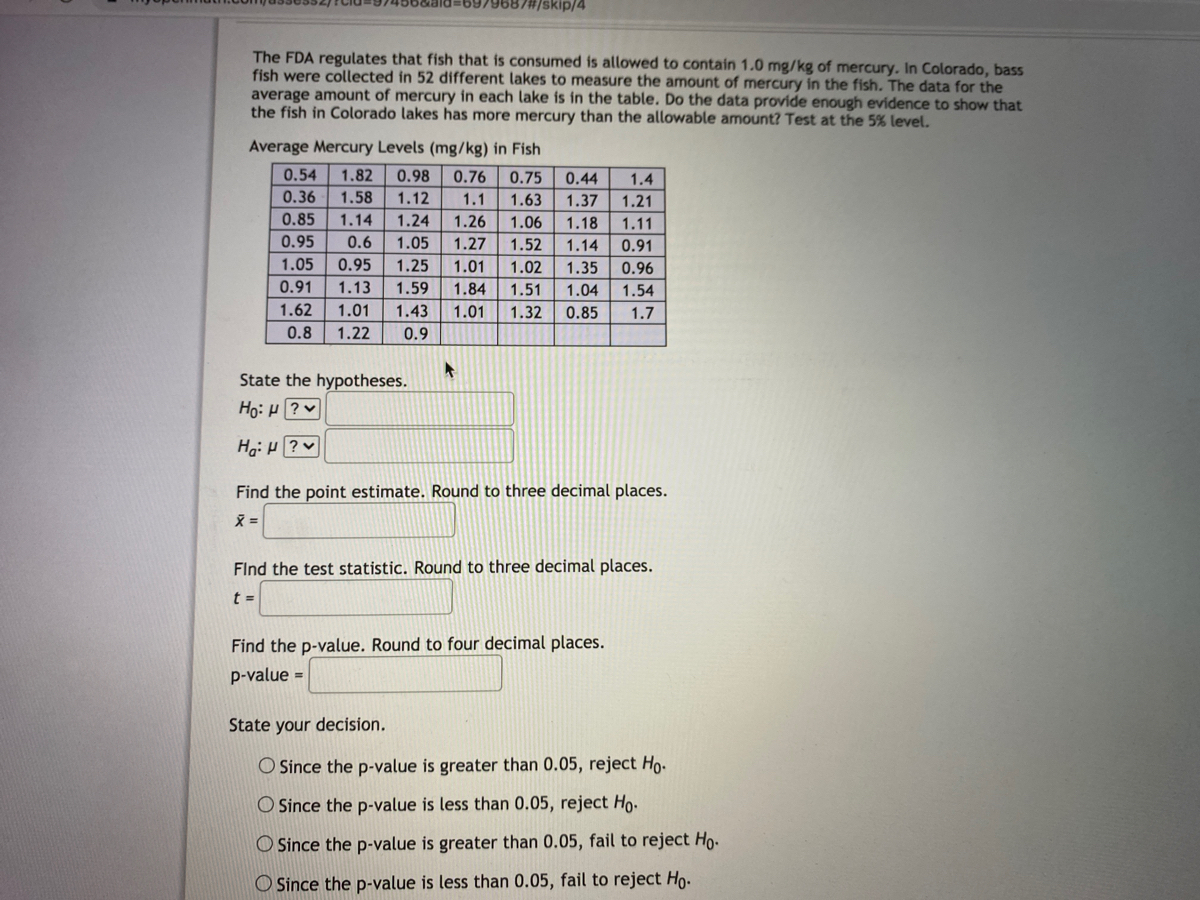
The FDA regulates that fish that is consumed is allowed to contain 1.0 mg/kg of mercury. In Colorado, bass
fish were collected in 52 different lakes to measure the amount of mercury in the fish. The data for the
average amount of mercury in each lake is in the table. Do the data provide enough evidence to show that
the fish in Colorado lakes has more mercury than the allowable amount? Test at the 5% level.
Average Mercury Levels (mg/kg) in Fish
0.54
1.82
0.98
0.76
0.75
0.44
1.4
0.36
1.58
1.12
1.1
1.63
1.37
1.21
0.85
1.14
1.24
1.26
1.06
1.18
1.11
0.95
0.6
1.05
1.27
1.52
1.14
0.91
1.05
0.95
1.25
1.01
1.02
1.35
0.96
0.91
1.13
1.59
1.84
1.51
1.04
1.54
1.62
1.01
1.43
1.01
1.32
0.85
1.7
0.8
1.22
0.9
State the hypotheses.
Ho: µ ?
Hg: ?
Find the point estimate. Round to three decimal places.
=
FInd the test statistic. Round to three decimal places.
t =
Find the p-value. Round to four decimal places.
p-value =
State your decision.
O Since the p-value is greater than 0.05, reject Ho.
O Since the p-value is less than 0.05, reject Ho.
O Since the p-value is greater than 0.05, fail to reject Ho.
O Since the p-value is less than 0.05, fail to reject Ho.

Transcribed Image Text:p-value =
State your decision.
O Since the p-value is greater than 0.05, reject Ho.
O Since the p-value is less than 0.05, reject Ho.
O Since the p-value is greater than 0.05, fail to reject Ho.
O Since the p-value is less than 0.05, fail to reject Ho.
Interpret the results.
O At the 5% level of significance, there is not enough evidence to conclude that the mean amount of
mercury in bass fish in Colorado is not equal to the allowable amount of 1.0 mg/kg.
O At the 5% level of significance, there is not enough evidence to conclude that the mean amount of
mercury in bass fish in Colorado is less than the allowable amount of 1.0 mg/kg.
O At the 5% level of significance, there is enough evidence to conclude that the mean amount of
mercury in bass fish in Colorado is not equal to the allowable amount of 1.0 mg/kg.
O At the 5% level of significance, there is enough evidence to conclude that the mean amount of
mercury in bass fish in Colorado is less than the allowable amount of 1.0 mg/kg.
O At the 5% level of significance, there is enough evidence to conclude that the mean amount of
mercury in bass fish in Colorado is more than the allowable amount of 1.0 mg/kg.
O At the 5% level of significance, there is not enough evidence to conclude that the mean amount of
mercury in bass fish in Colorado is more than the allowable amount of 1.0 mg/kg.
Question Help: D Post to forum
Submit Question
Expert Solution
This question has been solved!
Explore an expertly crafted, step-by-step solution for a thorough understanding of key concepts.

Step by stepSolved in 3 steps

Knowledge Booster


Learn more about
Need a deep-dive on the concept behind this application? Look no further. Learn more about this topic, statistics and related others by exploring similar questions and additional content below.Similar questions
- A first-semester freshman student took classes with associated grades as indicated in the table. Calculate the student's GPA (assume a 4-point grading scale). Round your answer to the nearest hundredth. Credits Course Grade 4 Biology Choir Calculus Tennis English 3 Psychology 1 A 3. B. D GPA = I Calculator > Next Question MacBook Air F1 20 E3 F2 F5 F7 F8 F10 # $ & * 2 3 4 5 7 8 W E R T Y U S D F G Harrow_forwardIn a survey from a certain year, the range of annual salaries reported was from $73,187 to $336,550. But do CEO salaries differ across the two most populous states in the United States? Consider the salaries from that year for CEOs who work for companies headquartered in California and Texas as provided in the following table. CEO Salaries (in $1,000s) California Texas $319 $92 $119 $214 $140 $159 $181 $246 $317 $198 $261 $305 $123 $185 $132 $202 $273 $90 $304 $179 $226 $208 $194 $109 Use α = 0.05 and test to determine whether the distribution of CEO salaries is the same for California and Texas. What is your conclusion?arrow_forwardPredict the percentage of female high school graduates in 2019. Round to the nearest tenth (1 decimal place). % thnkas for the help aprpeciated it 14g1iog15hoi15jh15oih 15j1i5h15 hij15h o1i5hj15h 1ijarrow_forward
- Calculate the z-score for the third value listed. Show step by step solution and explain work. 24,84,40,60,73,46,89,61,55,85arrow_forwardPlease don't forget to roundarrow_forwardRound Round 3 100 MODE. to the nearest tenth place. to the nearest ten-thousandths place. V QUESTION 14 Choose to compare the decimals. -2.6 QUESTION 15 Click Save and Submit to save and submit. Click Save Alarrow_forward
- Compute the P-value. Round the answer to four decimal places. P-value = X Sarrow_forwardlecture(12.2): A statistic class is made up of 28 students online and 21 students in person. What proportion of the class is learning online?. Round your answer to 2 decimal placesarrow_forwardFind the interval of z-values associated with each area. a. The middle 75% of the data. b. The top 5% of the dataarrow_forward
- Number of Students 30 25 2 15 10 5 0 S 10 1 15 3 20 SAMSUNG 2.5 24 3 30 Grade 28 35 SUBMIT QUESTION 19 40 25 45 SAVE PROGRESS 50 55 SUarrow_forwardAssume that the readings on the thermometers are normally distributed with a mean of 0° and standard deviation of 1.00°C. A thermometer is randomly selected and tested. Draw a sketch and find the temperature reading corresponding to P34, the 84th percentile. This is the temperature reading separating the bottom 84% from the top 16%. Click to view page 1 of the table. Click to view page 2 of the table. Which graph represents P ? Choose the correct graph below. 84 A. В. OC. D. Ay X The temperature for P84 is approximately (Round to two decimal places as needed.)arrow_forward
arrow_back_ios
arrow_forward_ios
Recommended textbooks for you
- MATLAB: An Introduction with ApplicationsStatisticsISBN:9781119256830Author:Amos GilatPublisher:John Wiley & Sons Inc
 Probability and Statistics for Engineering and th...StatisticsISBN:9781305251809Author:Jay L. DevorePublisher:Cengage Learning
 Statistics for The Behavioral Sciences (MindTap C...StatisticsISBN:9781305504912Author:Frederick J Gravetter, Larry B. WallnauPublisher:Cengage Learning
  Elementary Statistics: Picturing the World (7th E...StatisticsISBN:9780134683416Author:Ron Larson, Betsy FarberPublisher:PEARSON
 The Basic Practice of StatisticsStatisticsISBN:9781319042578Author:David S. Moore, William I. Notz, Michael A. FlignerPublisher:W. H. Freeman
 Introduction to the Practice of StatisticsStatisticsISBN:9781319013387Author:David S. Moore, George P. McCabe, Bruce A. CraigPublisher:W. H. Freeman
MATLAB: An Introduction with Applications
Statistics
ISBN:9781119256830
Author:Amos Gilat
Publisher:John Wiley & Sons Inc
Probability and Statistics for Engineering and th...
Statistics
ISBN:9781305251809
Author:Jay L. Devore
Publisher:Cengage Learning
Statistics for The Behavioral Sciences (MindTap C...
Statistics
ISBN:9781305504912
Author:Frederick J Gravetter, Larry B. Wallnau
Publisher:Cengage Learning
Elementary Statistics: Picturing the World (7th E...
Statistics
ISBN:9780134683416
Author:Ron Larson, Betsy Farber
Publisher:PEARSON
The Basic Practice of Statistics
Statistics
ISBN:9781319042578
Author:David S. Moore, William I. Notz, Michael A. Fligner
Publisher:W. H. Freeman
Introduction to the Practice of Statistics
Statistics
ISBN:9781319013387
Author:David S. Moore, George P. McCabe, Bruce A. Craig
Publisher:W. H. Freeman