
MATLAB: An Introduction with Applications
6th Edition
ISBN: 9781119256830
Author: Amos Gilat
Publisher: John Wiley & Sons Inc
expand_more
expand_more
format_list_bulleted
Related questions
Concept explainers
Topic Video
Question
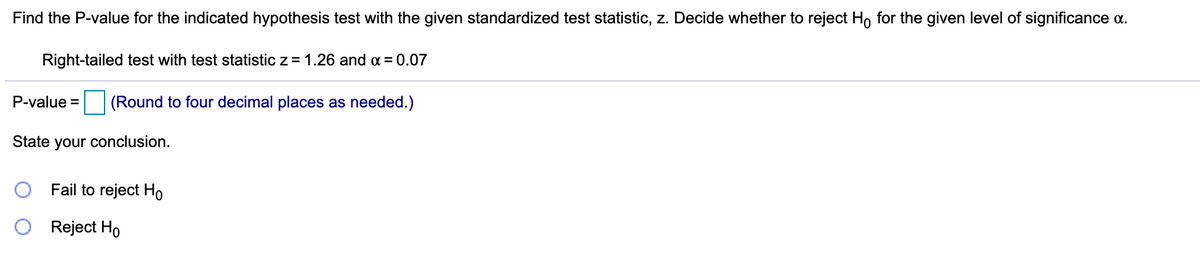

Transcribed Image Text:Find the P-value for the indicated hypothesis test with the given standardized test statistic, z. Decide whether to reject Ho for the given level of significance a.
Right-tailed test with test statistic z = 1.26 and a = 0.07
P-value =
(Round to four decimal places as needed.)
State your conclusion.
Fail to reject Ho
Reject Ho
Expert Solution
This question has been solved!
Explore an expertly crafted, step-by-step solution for a thorough understanding of key concepts.

This is a popular solution

Trending nowThis is a popular solution!

Step by stepSolved in 2 steps with 1 images

Knowledge Booster


Learn more about
Need a deep-dive on the concept behind this application? Look no further. Learn more about this topic, statistics and related others by exploring similar questions and additional content below.Similar questions
- A 8.3.12 Question Help A data set includes data from 500 random tornadoes. The display from technology available below results from using the tornado lengths (miles) to test the claim that the mean tornado length is greater than 2.5 miles. Use a 0.05 significance level. Identify the null and alternative hypotheses, test statistic, P-value, and state the final conclusion that addresses the original claim. A Click the icon to view the display from technology. Assuming all conditions for conducting a hypothesis test are met, what are the null and alternative hypotheses? O A. Ho: µ=2.5 miles H4: µ#2.5 miles OB. Ho: H= 2.5 miles H: µ> 2.5 miles O C. Ho: H<2.5 miles O D. Ho: H= 2.5 miles H1: µ= 2.5 miles H1: µ<2.5 miles Identify the test statistic. (Round to two decimal places as needed.)arrow_forwardDecide which of the following statistical procedureswould most likely be used to answer the research questions posed:a independent samples t-testb analysis of variancec single sample t-testd paired samples t-teste construct a confidence interval 14. Do scores on a test of science achievement differ for female and male 8th grade students? 15. A group of office mates decide to go on a diet. They each measure their weight pre-diet and providetheir ideal weight. After the dieting plan a few months later, each person is weighed. Is there a differencepre-dieting and post dieting?arrow_forwardFind the P-value for the indicated hypothesis test with the given standardized test statistic, z. Decide whether to reject H0 for the given level of significance α. Two-tailed test with test statistic z=−1.86 and α=arrow_forward
- Find the P-value for the indicated hypothesis test with the given standardized test statistics z. Decide whether to reject H0 for the given level of significance α. Left-tailed test, z=-1.32, α=0.10 Right-tailed test, z=2.46, α=0.01 Two-tailed test, z=-1.68, α=0.05arrow_forwardFind the P-value for the indicated hypothesis test with the given standardized test statistic, z. Decide whether to reject H, for the given level of significance a. Right-tailed test with test statistic z = 1.89 and a = 0.03 P-value = (Round to four decimal places as needed.)arrow_forwardAn electrician wants to know whether batteries made by two manufacturers have significantly different voltages. The voltage of 131 batteries from each manufacturer were measured. The population standard deviations of the voltage for each manufacturer are known. The results are summarized in the following table. Manufacturer Sample mean voltage (millivolts) Population standard deviat A 116 3 115 4 What type of hypothesis test should be performed? Right-tailed z-test v What is the test statistic? Ex: 0.12 Does sufficient evidence exist to support the claim that the voltage of the batteries made by the two manufacturers is different at the a = 0.01 significance level? Select varrow_forward
- An electrician wants to know whether batteries made by two manufacturers have significantly different voltages. The voltage of 50 batteries from each manufacturer were measured. The population standard deviations of the voltage for each manufacturer are known. The results are summarized in the following table. Manufacturer Sample mean voltage (millivolts) Population standard deviati A B 130 129 What type of hypothesis test should be performed? Select What is the test statistic? Ex: 0.12 1 4 Does sufficient evidence exist to support the claim that the voltage of the batteries made by the two manufacturers is different at the a = 0.05 significance level? Selectarrow_forwardFind the P-value for the indicated hypothesis test with the given standardized test statistic, z. Decide whether to reject H0 for the given level of significance α. Right-tailed test with test statistic z=1.85 and α=0.09 P-value=enter your response here (Round to four decimal plaarrow_forwardThe cost of a car is $30k at Joe's Garage. You cant to see if the cost is lower at Pete's Garage. To test, you collect data from 64 buyers who recently bought cars. The average of your sample is $29,760, with a sample standard deviation of $7,450. Using this data to perform the hypothesis test with H0: u=30,000 vs H0:u<30,000, what is the p-value of this test, and what is the conclusion of this test at the a=.05 level?arrow_forward
- Find the P-value for the indicated hypothesis test with the given standardized test statistic, z. Decide whether to reject H, for the given level of significance a. Two-tailed test with test statistic z= - 1.76 and a = 0.06 P-value = | (Round to four decimal places as needed.) State your conclusion. O Fail to reject Ho O Reject Hoarrow_forwardFind the P-value for the indicated hypothesis test with the given standardized test statistic, z. Decide whether to reject H, for the given level of significance a. Two-tailed test with test statistic z = - 1.69 and a = 0.07 P-value = (Round to four decimal places as needed.)arrow_forwarduse statcrunch or explain how to solve on statcruncharrow_forward
arrow_back_ios
SEE MORE QUESTIONS
arrow_forward_ios
Recommended textbooks for you
- MATLAB: An Introduction with ApplicationsStatisticsISBN:9781119256830Author:Amos GilatPublisher:John Wiley & Sons Inc
 Probability and Statistics for Engineering and th...StatisticsISBN:9781305251809Author:Jay L. DevorePublisher:Cengage Learning
 Statistics for The Behavioral Sciences (MindTap C...StatisticsISBN:9781305504912Author:Frederick J Gravetter, Larry B. WallnauPublisher:Cengage Learning
  Elementary Statistics: Picturing the World (7th E...StatisticsISBN:9780134683416Author:Ron Larson, Betsy FarberPublisher:PEARSON
 The Basic Practice of StatisticsStatisticsISBN:9781319042578Author:David S. Moore, William I. Notz, Michael A. FlignerPublisher:W. H. Freeman
 Introduction to the Practice of StatisticsStatisticsISBN:9781319013387Author:David S. Moore, George P. McCabe, Bruce A. CraigPublisher:W. H. Freeman
MATLAB: An Introduction with Applications
Statistics
ISBN:9781119256830
Author:Amos Gilat
Publisher:John Wiley & Sons Inc
Probability and Statistics for Engineering and th...
Statistics
ISBN:9781305251809
Author:Jay L. Devore
Publisher:Cengage Learning
Statistics for The Behavioral Sciences (MindTap C...
Statistics
ISBN:9781305504912
Author:Frederick J Gravetter, Larry B. Wallnau
Publisher:Cengage Learning
Elementary Statistics: Picturing the World (7th E...
Statistics
ISBN:9780134683416
Author:Ron Larson, Betsy Farber
Publisher:PEARSON
The Basic Practice of Statistics
Statistics
ISBN:9781319042578
Author:David S. Moore, William I. Notz, Michael A. Fligner
Publisher:W. H. Freeman
Introduction to the Practice of Statistics
Statistics
ISBN:9781319013387
Author:David S. Moore, George P. McCabe, Bruce A. Craig
Publisher:W. H. Freeman