
MATLAB: An Introduction with Applications
6th Edition
ISBN: 9781119256830
Author: Amos Gilat
Publisher: John Wiley & Sons Inc
expand_more
expand_more
format_list_bulleted
Related questions
Question
Identify the test statistic.
Identify the p-value.
What is the conclusion for this hypothesis test?
What is the fundamental error with this analysis?
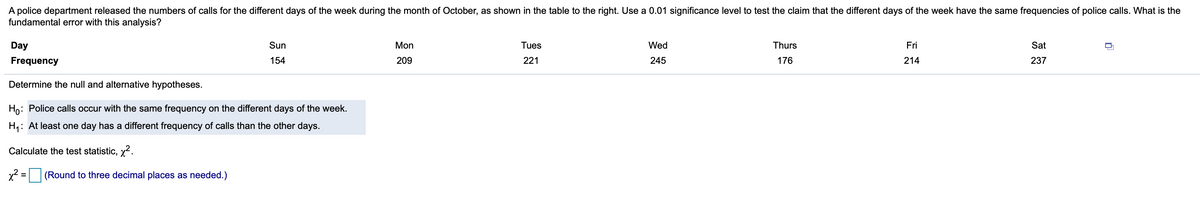

Transcribed Image Text:A police department released the numbers of calls for the different days of the week during the month of October, as shown in the table to the right. Use a 0.01 significance level to test the claim that the different days of the week have the same frequencies of police calls. What is the
fundamental error with this analysis?
Day
Sun
Mon
Tues
Wed
Thurs
Fri
Sat
Frequency
154
209
221
245
176
214
237
Determine the null and alternative hypotheses.
Ho: Police calls occur with the same frequency on the different days of the week.
H,: At least one day has a different frequency of calls than the other days.
Calculate the test statistic, x2.
x2 =
(Round to three decimal places as needed.)
Expert Solution
This question has been solved!
Explore an expertly crafted, step-by-step solution for a thorough understanding of key concepts.

This is a popular solution

Trending nowThis is a popular solution!

Step by stepSolved in 5 steps with 2 images

Knowledge Booster


Learn more about
Need a deep-dive on the concept behind this application? Look no further. Learn more about this topic, statistics and related others by exploring similar questions and additional content below.Similar questions
- Use technology to find the P-value for the hypothesis test described below. The claim is that for a smartphone carrier's data speeds at airports, the mean is μ=16.00 Mbps. The sample size is n=14 and the test statistic is t=2.325. P-value= nothing (Round to three decimal places as needed.)arrow_forwardPlz help asap 32arrow_forward(Problem for Questions 22- 25). In a study focusing on children on the autism spectrum a team of psychologists were interested in the distribution of the children on the spectrum. After having 100 children complete some tests, they categorized children as Low, Medium, High on the autism spectrum. They counted how many children were in each category and this is what they came up with: Low AS 44 Medium AS 30 High AS 26arrow_forward
- When the null hypothesis is true, the F test statistic is close to .When the null hypothesis is false, the F test statistic is most likelyarrow_forwardFor the following cases, you may use either the P-value approach or the rejection region approach to present a full hypothesis test, including: Identifying the claim and H0 and Ha, Finding the appropriate standardized test statistic, Finding the P-value or the rejection region, Deciding whether to reject or fail to reject the null hypothesis, and Interpreting the decision in the context of the original claim. A fitness magazine advertises that the mean monthly cost of joining a health club is less than $25. You work for a consumer advocacy group and are asked to test this claim. You find that a random sample of 18 clubs has a mean monthly cost of $26.25 and a standard deviation of $3.23. Perform the appropriate hypothesis test at α = 0.10.arrow_forwardFemale Physicians The percentage of physicians who are women is 27.9%. In a survey of physicians employed by a large university health system, 37 of 114 randomly selected physicians were women. Is there sufficient evidence at the 0.05 level of significance to conclude that the proportion of women physicians at the university health system exceeds 27.9%?Do not round intermediate steps. H0= (claim or not claim) H1= (claim or not claim) This hypothesis test is a (one tailed or two tailed) test Critical value(s)= z= (Reject or do not reject) the null hypothesis is there enough evidence to support the claim?arrow_forward
- Use technology to find the P-value for the hypothesis test described below. The claim is that for a smartphone carrier's data speeds at airports, the mean is p= 18.00 Mbps. The sample size is n = 20 and the test statistic is t= 1.094. P-value= |(Round to three decimal places as needed.)arrow_forwardUse technology to find the P-value for the hypothesis test described below.The claim is that for a smartphone carriers data speeds at airports, the mean is 12.00 Mbps. The sample size is n=21 and the test statistic is t=-1.149. Find the P-value. (Round to three decimal places as needed.)arrow_forwardWhat does it mean when sample results are statistically significant?arrow_forward
- The critical boundaries for a hypothesis test are z = +1.96 and -1.96. If the z-score for the sample data is z =-1.90, what is the correct statistical decision? Reject H0 Fail to reject H1 Reject H1 Fail to reject H0arrow_forwardUse technology to find the P-value for the hypothesis test described below. The claim is that for a smartphone carrier's data speeds at airports, the mean is u = 15.00 Mbps. The sample size is n = 20 and the test statistic is t= 2.079. P-value = (Round to three decimal places as needed.)arrow_forwardQ3 Test the given claim. Identify the null hypothesis, alternative hypothesis, test statistic, P-value, and then state the conclusion about the null hypothesis, as well as the final conclusion that addresses the original claim. Among 2125 passengers cars in a particular region, 229 had only rear license plates. Among 326 commercial trucks, 47 had only rear license plates. A reasonable hypothesis is that commercial trucks owners violate laws requiring front license plates at a higher rate than owners of passengers cars. Use a 0.01 significance level to test that hypothesis. A. Identity the nulls and alternative hypotheses B. Identify the test statistic ( round to two decimal places as needed) C. Identify the p- values (round to two decimal places as needed ? State the conclusion about the null hypothesis, as well as the final conclusion that addresses the original claim. A. Fail to reject Ho. There is not sufficient evidence to support the claim that commercial trucks owners…arrow_forward
arrow_back_ios
SEE MORE QUESTIONS
arrow_forward_ios
Recommended textbooks for you
- MATLAB: An Introduction with ApplicationsStatisticsISBN:9781119256830Author:Amos GilatPublisher:John Wiley & Sons Inc
 Probability and Statistics for Engineering and th...StatisticsISBN:9781305251809Author:Jay L. DevorePublisher:Cengage Learning
 Statistics for The Behavioral Sciences (MindTap C...StatisticsISBN:9781305504912Author:Frederick J Gravetter, Larry B. WallnauPublisher:Cengage Learning
  Elementary Statistics: Picturing the World (7th E...StatisticsISBN:9780134683416Author:Ron Larson, Betsy FarberPublisher:PEARSON
 The Basic Practice of StatisticsStatisticsISBN:9781319042578Author:David S. Moore, William I. Notz, Michael A. FlignerPublisher:W. H. Freeman
 Introduction to the Practice of StatisticsStatisticsISBN:9781319013387Author:David S. Moore, George P. McCabe, Bruce A. CraigPublisher:W. H. Freeman
MATLAB: An Introduction with Applications
Statistics
ISBN:9781119256830
Author:Amos Gilat
Publisher:John Wiley & Sons Inc
Probability and Statistics for Engineering and th...
Statistics
ISBN:9781305251809
Author:Jay L. Devore
Publisher:Cengage Learning
Statistics for The Behavioral Sciences (MindTap C...
Statistics
ISBN:9781305504912
Author:Frederick J Gravetter, Larry B. Wallnau
Publisher:Cengage Learning
Elementary Statistics: Picturing the World (7th E...
Statistics
ISBN:9780134683416
Author:Ron Larson, Betsy Farber
Publisher:PEARSON
The Basic Practice of Statistics
Statistics
ISBN:9781319042578
Author:David S. Moore, William I. Notz, Michael A. Fligner
Publisher:W. H. Freeman
Introduction to the Practice of Statistics
Statistics
ISBN:9781319013387
Author:David S. Moore, George P. McCabe, Bruce A. Craig
Publisher:W. H. Freeman