MATLAB: An Introduction with Applications
6th Edition
ISBN: 9781119256830
Author: Amos Gilat
Publisher: John Wiley & Sons Inc
expand_more
expand_more
format_list_bulleted
Question

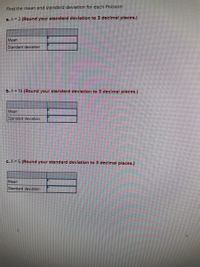
Transcribed Image Text:Find the mean and standard deviation for each Poisson:
a.A=2 (Round your standard devlatlon to 3 declmal places.)
Mean
Standard deviation
b. A = 19 (Round your standard devlatlon to 3 declmal places.)
Mean
Standard deviation
c. A = 5 (Round your standard devlatlon to 3 declImal places.)
Mean
Standard deviation
Expert Solution
This question has been solved!
Explore an expertly crafted, step-by-step solution for a thorough understanding of key concepts.
Step by stepSolved in 4 steps

Knowledge Booster
Similar questions
- The average age of senators in the 108th Congress was 62 years. If the standard deviation was 12.5 years, find the z-scores corresponding to the oldest and youngest senators of age 86 and 46. Round z scores to two decimal places.arrow_forwardJohn wishes to estimate the population standard deviation of salary of college graduates who took a statistics course in college. How many college graduates must he survey? Assume that he wants to be the sample standard deviation to be within 1% of the population standard deviation and to be 99% confident of that statement.arrow_forwardA different investor decides to invest $8000 in Fund A and $3000 in Fund B. Assuming the amounts gained by the two funds are independent, what are the mean and standard deviation of the amount gained by this investment in the first month?arrow_forward
- Assume that thermometer readings are normally distributed with a mean of 0degrees°C and a standard deviation of 1.00degrees°C. A thermometer is randomly selected and tested. (The given values are in Celsius degrees.) Between -1.47and 1.76arrow_forwardAssume that the readings at freezing on a batch of thermometers are normally distributed with a mean of 0°C and a standard deviation of 1.00°C. A single thermometer is randomly selected and tested. Find P30, the 30-percentile. This is the temperature reading separating the bottom 30% from the top 70%.P30 = °C(Round answer to three decimal places)arrow_forwardA clinic finds that the average patient stay is 5.7 hours with a standard deviation of 1.8. If a patient has a relative stay of 2.4, find how many hours the patient was in the clinic. Give a 2-decimal answerarrow_forward
- Assume that the Leaf Area Index over a management area is normally distributed with a mean of 3 and a standard deviation of 0.2. One sample area shows a LAI of 2.76. How many standard deviations is this measurement from the mean?arrow_forwardAssume that the readings on the thermometers are normally distributed with a mean of 0° and standard deviation of 1.00°C. A thermometer is randomly selected and tested. Draw a sketch and find the temperature reading corresponding to Pa1, the 91st percentile. This is the temperature reading separating the bottom 91% from the top 9%. Click to view page 1 of the table Click to view page 2 of the table. Which graph represents Pa,? Choose the correct graph below. OD. Oc. OB. OA. Ay The temperature for P91 is approximately . (Round to two decimal places as needed.) XLSX Click to select vour answerls). 33283.xls Exit Honorlock 22 MacBook Air 吕0 000 000 F4 F3 F6 F7 F8 F9 FIC #3 2$ * 3 4 5 6 7 8 E R Y Uarrow_forwardFind the mean and standard deviation for each Poisson: a. A = 6 (Round your standard deviation to 3 decimal places.) Mean Standard deviation b. A = 18 (Round your standard deviation to 3 decimal places.) Mean Standard deviation c. A = 3 (Round your standard deviation to 3 decimal places.) Mean Standard deviationarrow_forward
arrow_back_ios
arrow_forward_ios
Recommended textbooks for you
 MATLAB: An Introduction with ApplicationsStatisticsISBN:9781119256830Author:Amos GilatPublisher:John Wiley & Sons Inc
 Probability and Statistics for Engineering and th...StatisticsISBN:9781305251809Author:Jay L. DevorePublisher:Cengage Learning
 Statistics for The Behavioral Sciences (MindTap C...StatisticsISBN:9781305504912Author:Frederick J Gravetter, Larry B. WallnauPublisher:Cengage Learning
 Elementary Statistics: Picturing the World (7th E...StatisticsISBN:9780134683416Author:Ron Larson, Betsy FarberPublisher:PEARSON
 The Basic Practice of StatisticsStatisticsISBN:9781319042578Author:David S. Moore, William I. Notz, Michael A. FlignerPublisher:W. H. Freeman
 Introduction to the Practice of StatisticsStatisticsISBN:9781319013387Author:David S. Moore, George P. McCabe, Bruce A. CraigPublisher:W. H. Freeman

MATLAB: An Introduction with Applications
Statistics
ISBN:9781119256830
Author:Amos Gilat
Publisher:John Wiley & Sons Inc

Probability and Statistics for Engineering and th...
Statistics
ISBN:9781305251809
Author:Jay L. Devore
Publisher:Cengage Learning

Statistics for The Behavioral Sciences (MindTap C...
Statistics
ISBN:9781305504912
Author:Frederick J Gravetter, Larry B. Wallnau
Publisher:Cengage Learning

Elementary Statistics: Picturing the World (7th E...
Statistics
ISBN:9780134683416
Author:Ron Larson, Betsy Farber
Publisher:PEARSON

The Basic Practice of Statistics
Statistics
ISBN:9781319042578
Author:David S. Moore, William I. Notz, Michael A. Fligner
Publisher:W. H. Freeman

Introduction to the Practice of Statistics
Statistics
ISBN:9781319013387
Author:David S. Moore, George P. McCabe, Bruce A. Craig
Publisher:W. H. Freeman