
MATLAB: An Introduction with Applications
6th Edition
ISBN: 9781119256830
Author: Amos Gilat
Publisher: John Wiley & Sons Inc
expand_more
expand_more
format_list_bulleted
Related questions
Question
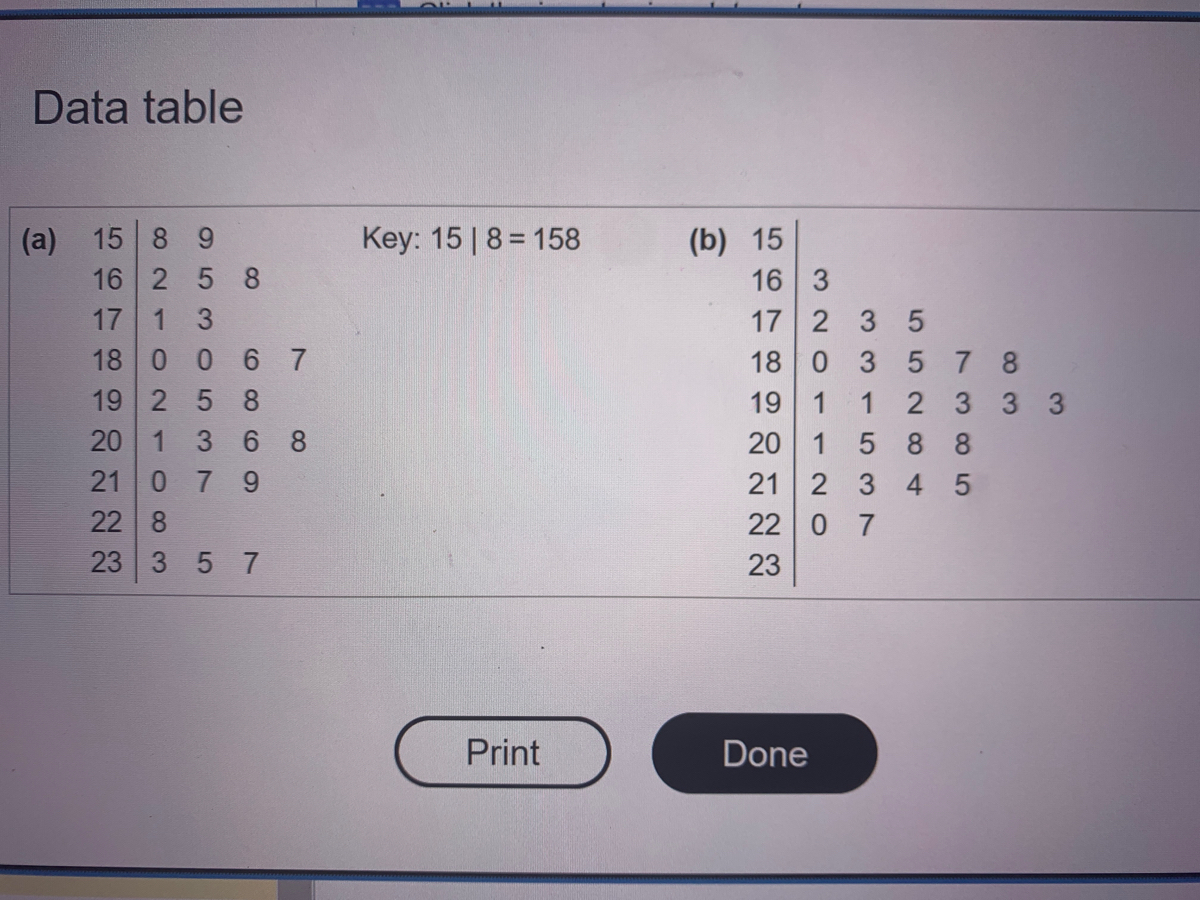

Transcribed Image Text:Data table
(a) 15 8 9
16 2 5 8
17 1 3
18 0 0 67
19 258
20 1
21 0 7 9
22 8
23 3 5 7
368
Key: 15 | 8 = 158
Print
(b) 15
16
3
17 2 3 5
18 0 3 578
19 1 1
20 1 5
88
21 2 3 4 5
22 07
23
Done
2 3 3 3

Transcribed Image Text:Both data sets have a mean of 195. One has a standard deviation of 16, and the other
has a standard deviation of 24.
Click the icon to view data sets.
Which data set has which deviation?
...
O A. (a) has a standard deviation of 24 and (b) has a standard deviation of 16,
because the data in (a) have more variability.
OB. (a) has a standard deviation of 16 and (b) has a standard deviation of 24,
because the data in (b) have less variability.
Expert Solution
This question has been solved!
Explore an expertly crafted, step-by-step solution for a thorough understanding of key concepts.

This is a popular solution

Trending nowThis is a popular solution!

Step by stepSolved in 3 steps

Knowledge Booster

Similar questions
- For an exam with a mean of M = 74 and a standard deviation of s = 8, Mary has a score of X = 80, Bob’s score corresponds to z = +1.50, and Sue’s score is located above the mean by 10 points. What is the order of these three people from lowest to highest z-score? a. Mary, Sue, Bob b. Bob, Sue, Mary c. Sue, Bob, Mary d. Sue, Mary, Bobarrow_forwardA student scores 74 on a geography test and 264 on a mathematics test. The geography test has a mean of 80 and a standard deviation of 5. The mathematics test has a mean of 300 and a standard deviation of 24. If the data for both tests are normally distributed, on which test did the student score better relative to the other students in each class? OA. The student scored better on the mathematics test. OB. The student scored better on the geography test. OC. The student scored the same on both tests.arrow_forwardFor a data set of the pulse rates for a sample of adult females, the lowest pulse rate is 38beats per minute, the mean of the listed pulse rates is x =73.0 beats per minute, and their standard deviation is sequals=23.2 beats per minute. a. What is the difference between the pulse rate of 38 beats per minute and the mean pulse rate of the females? b. How many standard deviations is that [the difference found in part (a)]? c. Convert the pulse rate of 38 beats per minutes to a z score. d. If we consider pulse rates that convert to z scores between minus−2 and 2 to be neither significantly low nor significantly high, is the pulse rate of 38 beats per minute significant?arrow_forward
- Identify the symbols used for each of the following: (a) sample standard deviation; (b) population standard deviation; (c) sample variance; (d) population variance. If sample data consist of weights measured in grams, what units are used for these statistics and parameter a. The symbol for sample standard deviation is b. The symbol for population standard deviation is c. The symbol for sample variance is d. The symbol for population variance is If sample data consist of weights measured in grams, then correctly complete the following sentences. a. The unit for sample standard deviation would be b. The unit for population standard deviation would be C. The unit for sample variance would be ▼ d. The unit for population variance would be ▼ Carrow_forwardSuppose that you have a set of data that has a mean of 34 and a standard deviation of 6. a) Is the point 28 above, below, or the same as the mean. How many standard deviations is 28 from the mean. b) Is the point 46 above, below, or the same as the mean. How many standard deviations is 46 from the mean. c) Is the point 43 above, below, or the same as the mean. How many standard deviations is 43 from the mean. d) Is the point 20 above, below, or the same as the mean. How many standard deviations is 20 from the mean.arrow_forwardAlice was told that her reading test score was one standard deviation below to me if test scores were approximately normal with m= 86 and standard deviation= 4. What was Alice's score?arrow_forward
- There are two national college-entrance examinations, the scholastic aptitude test (SAT) and the American College Testing program (ACT). Scores on the SATs are approximately normal with mean 500 and standard deviation 100. Scores on the ACTs are approximately normal with mean 18 and standard deviation 6. Use the links provided for the Normal (Links to an external site.)calculator and the Inverse Normal (Links to an external site.) calculator to help complete the problems, you do not need to do any work out by hand. (instructions on how to use these calculators can be found in the week 5 star on the home page) a) What percent of all SAT scores are above 600? b) Which is the greater accomplishment, scoring 630 on the SAT or 22 on the ACT ? Explain your reasoning for your choice. c) How high a score in the SAT is needed to place in the top 2.5%.arrow_forwardIn a recent year, the mean test score was 1539 1539 and the standard deviation was 310 310. The test scores of four students selected at random are 1950 1950, 1300 1300, 2270 2270, and 1430 1430. Find the z-scores that correspond to each value and determine whether any of the values are unusualarrow_forwardUse the following information for the question. The average travel time to work for a person living and working in Kokomo, Indiana is 17 minutes. Suppose the standard deviation of travel time to work is 4.5 minutes and the distribution of travel time is approximately normally distributed.Which of these statements is asking for a measurement (i. e. is an inverse normal question)? A.What percentage of people living and working in Kokomo have a travel time to work that is between thirteen and fifteen minutes? B.If 15% of people living and working in Kokomo have travel time to work that is below a certain number of minutes, how many minutes would that be?arrow_forward
- A data set lists weights (Ib) of plastic discarded by households. The highest weight is 5.72 Ib, the mean of all of the weights is x= 2.345 lb, and the standard deviation of the weights is s =2.123 lb. a. What is the difference between the weight of 5.72 lb and the mean of the weights? b. How many standard deviations is that (the difference found in part (a))? c. Convert the weight of 5.72 Ib to a z score d. If we consider weights that convert to z scores between -2 and 2 to be neither significantly low nor significantly high, is the weight of 5.72 Ib significant? a. The difference is lb. (Type an integer or a decimal. Do not round.) b. The difference is standard deviations. (Round to two decimal places as needed.) c. The z score is z= (Round to two decimal places as needed.) d. The highest weight isarrow_forward5. The average weight of a newborn baby is 7.5 lbs with a standard deviation of 1.25 lbs. The average weight of a newborn elephant is 244 lbs with a standard deviation of 15 lbs. Find the Coefficient of Variation for the baby and the elephant. What does the information tell you?arrow_forward
arrow_back_ios
arrow_forward_ios
Recommended textbooks for you
- MATLAB: An Introduction with ApplicationsStatisticsISBN:9781119256830Author:Amos GilatPublisher:John Wiley & Sons Inc
 Probability and Statistics for Engineering and th...StatisticsISBN:9781305251809Author:Jay L. DevorePublisher:Cengage Learning
 Statistics for The Behavioral Sciences (MindTap C...StatisticsISBN:9781305504912Author:Frederick J Gravetter, Larry B. WallnauPublisher:Cengage Learning
  Elementary Statistics: Picturing the World (7th E...StatisticsISBN:9780134683416Author:Ron Larson, Betsy FarberPublisher:PEARSON
 The Basic Practice of StatisticsStatisticsISBN:9781319042578Author:David S. Moore, William I. Notz, Michael A. FlignerPublisher:W. H. Freeman
 Introduction to the Practice of StatisticsStatisticsISBN:9781319013387Author:David S. Moore, George P. McCabe, Bruce A. CraigPublisher:W. H. Freeman
MATLAB: An Introduction with Applications
Statistics
ISBN:9781119256830
Author:Amos Gilat
Publisher:John Wiley & Sons Inc
Probability and Statistics for Engineering and th...
Statistics
ISBN:9781305251809
Author:Jay L. Devore
Publisher:Cengage Learning
Statistics for The Behavioral Sciences (MindTap C...
Statistics
ISBN:9781305504912
Author:Frederick J Gravetter, Larry B. Wallnau
Publisher:Cengage Learning
Elementary Statistics: Picturing the World (7th E...
Statistics
ISBN:9780134683416
Author:Ron Larson, Betsy Farber
Publisher:PEARSON
The Basic Practice of Statistics
Statistics
ISBN:9781319042578
Author:David S. Moore, William I. Notz, Michael A. Fligner
Publisher:W. H. Freeman
Introduction to the Practice of Statistics
Statistics
ISBN:9781319013387
Author:David S. Moore, George P. McCabe, Bruce A. Craig
Publisher:W. H. Freeman